Autoscaling Mesos Clusters with Clusterman

-
David R. Morrison, Compute Infra Tech Lead
- Feb 19, 2019
Here at Yelp, we host a lot of servers in the cloud. In order to make our website more reliable—yet cost-efficient during periods of low utilization—we need to be able to autoscale clusters based on usage metrics. There are quite a few existing technologies for this purpose, but none of them really meet our needs of autoscaling extremely diverse workloads (microservices, machine learning jobs, etc.) at Yelp’s scale.
In this post, we’ll describe our new in-house autoscaler called Clusterman (the “Cluster Manager”) and its magical ability to unify autoscaling resource requests for diverse workloads. We’ll also describe the Clusterman simulator, which we use not only to verify that our code is working correctly, but also to predict operating costs based on hypothetical data. And just to pique your interest, we’d like to note that Clusterman is now the de facto autoscaler at Yelp, and is able to begin autoscaling new clusters with just a couple hours of work!
So you want to run a Mesos cluster; would you like autoscaling with that?
First, let’s start with some preliminaries: there are lots of different models for distributed computation out there, and not all of them can be autoscaled in the same way. For the purpose of this post, we’ll focus on autoscaling strategies for distributed clusters running Apache Mesos.
Apache Mesos is an open-source project that abstracts away the specific properties of servers in your cluster, and essentially allows developers to treat that cluster as one large computer. In order to make our clusters ready for autoscaling, we’ve designed our applications to be relatively fault tolerant so they can easily handle the loss of a compute node in one of our Mesos clusters.
Now, let’s consider some different types of workloads we might want to autoscale. At Yelp, we have numerous types of distributed computation that we want to perform, ranging from long-running services (such as the web service hosting this very blog!), to periodic batch jobs (for doing image classification or analyzing ad revenue), unit and integration tests, machine learning, and many more! Each of these applications have a different usage pattern and level of fault tolerance, so it’s important to have an autoscaler that can handle them all.
Finally, let’s think about this from an operational standpoint for a minute. At Yelp, we know that people make mistakes all the time, and our goal is to provide safeguards that minimize the impact of those mistakes. The problem with autoscaling is that it’s invisible when it works, catastrophic when it doesn’t, and nearly impossible to test except on production workloads. Ideally, we’d like to design a solution that catches errors before they take down our website.
Enter Clusterman: 50% autoscaler, 50% simulation environment, 100% love
There’s a lot of prior art on how to build an autoscaler. At Yelp, we built at least two different autoscalers before Clusterman (the “Cluster Manager”) was born! This new autoscaling project has allowed us to consolidate our engineering efforts in one place, while simultaneously handling a wide range of distributed computation workloads.
The key idea behind this design is to separate the data from the business logic, as shown in the following diagram:
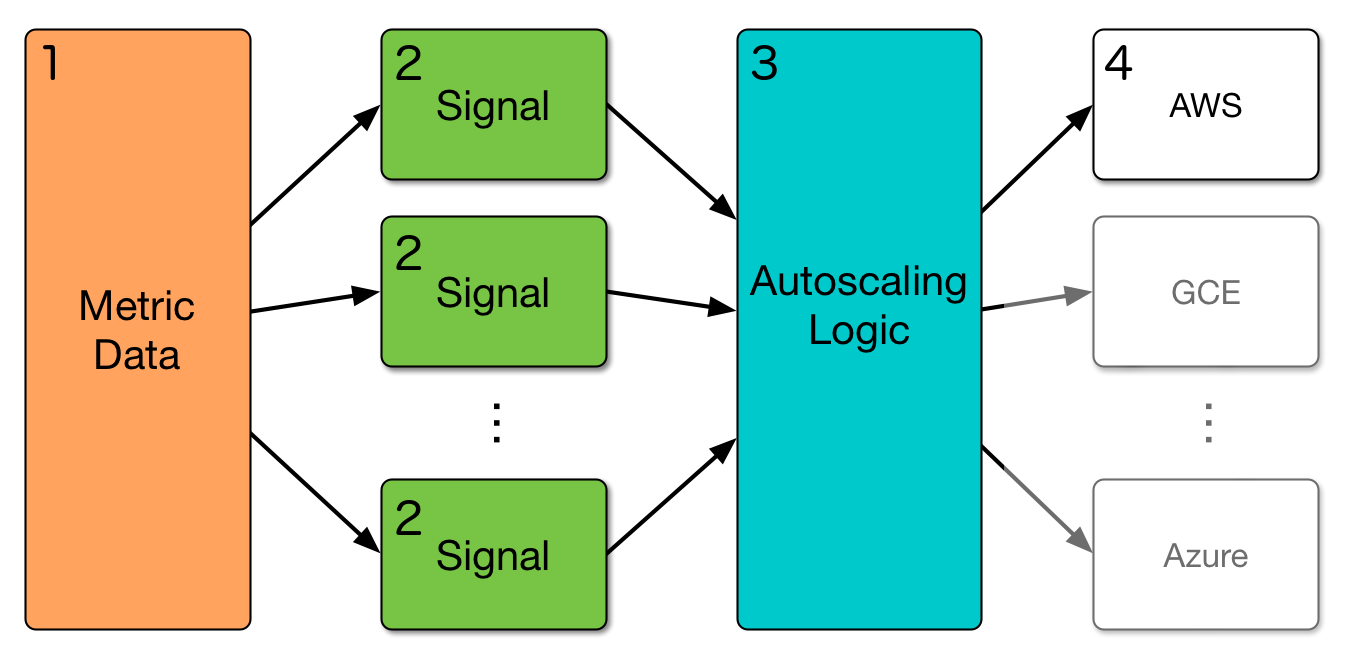
Figure 1: The Clusterman architecture diagram. Yelp's infrastructure is hosted on AWS, but in principle Clusterman can integrate seamlessly with any cloud provider.
We’re a data-driven organization at Yelp, so the most important component of our autoscaler is the actual data itself. We collect all kinds of data about our clusters, ranging from the number and type of machines in the cluster, to the amount of resources allocated by Mesos frameworks running on the cluster, as well as many application-specific metrics such as, “How many developers are trying to run unit tests on this cluster right now?” Much of this load is periodic, which we can take advantage of for autoscaling purposes (Figure 2). All of these data points are collected per minute and stored in Amazon’s DynamoDB, which works great for storing timeseries data (Figure 1, Step 1).
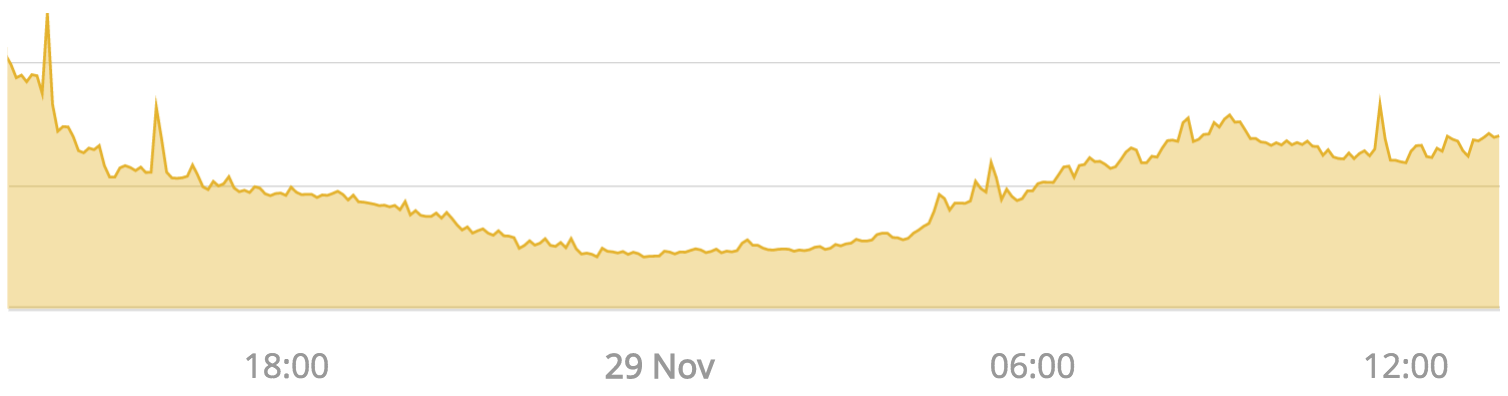
Figure 2: The CPU load range for our biggest service, yelp-main.
Next, this data is passed into autoscaling signals (Figure 1, Step 2), which indicate how many resources each application thinks it will need in the upcoming minutes. The key insight here is that every application will need a different signal, and we can’t know the ins and outs of every application running on the cluster. So, at Yelp, these signals are owned by the teams that running the applications, and we use configuration files to specify what versions of which signals we want to use for each cluster. The input and output of these signals is specified through a simple API, which allows a team to plug-and-play various signals as they please.
The use of “pluggable” signals is the secret sauce that makes it easy for new teams and projects to take advantage of Clusterman. Each signal can be as simple as just a few lines of Python code or as complex as a machine-learning-driven prediction algorithm. For example, the default signal used by Clusterman looks at the current utilization (CPUs, memory, and disk) of the cluster and scales up or down to maintain a constant load fraction; however, CPU utilization is not a great metric for other types of workloads, so our unit-testing cluster instead uses the number of developers currently trying to run tests and bases its autoscaling requests on that number. Even more recently, we’ve added a signal that allows our cluster that runs Spark jobs to be autoscaled based on the number of Spark jobs in flight and the amount of resources they’ve requested. And because all the signals are independent, nobody has to worry about what anyone else is doing on the cluster.
The output from each signal is collected and aggregated by the core Clusterman autoscaler (Figure 1, Step 3), which is then responsible for analyzing all of the signal requests and deciding what to do (scale up, scale down, or do nothing). Once it’s made a decision, it communicates with the cloud provider (Figure 1, Step 4) to provision or terminate machines as needed (in our case, the cloud provider is AWS, but this is modularized so there’s no reason you couldn’t use something else).
So this solves half of the equation: how to handle different types of workloads with one common system. But there’s still the issue of how to make sure your autoscaling will do the right thing on production traffic. This is exactly where the Clusterman simulation environment comes in!
To put it simply, we’ve developed an entire simulated ecosystem that allows you to test out changes to the autoscaling logic before deployment. You can use randomly-generated metrics for this simulation, replay production metrics from a previous time period, or use any combination of the two that you like. Not only does this allow you to check for bugs in the code against production data, but you can also start answering hypothetical questions like, “How much more money would I spend if our website traffic doubled next week?”
Enough talk, show me pretty pictures!
Let’s take a look at some actual data from one of our clusters. This cluster runs Jolt, our internal distributed unit and integration testing framework. To give you a sense of scale, the code powering yelp.com has about 100,000 unit and integration tests. Running these back-to-back would take a couple of days, and we run all of them about 400 times a day with less than 30 minutes per run. So this cluster definitely earns its keep! Here’s a graph from our internal monitor showing the usage on the cluster during the month of December 2018:
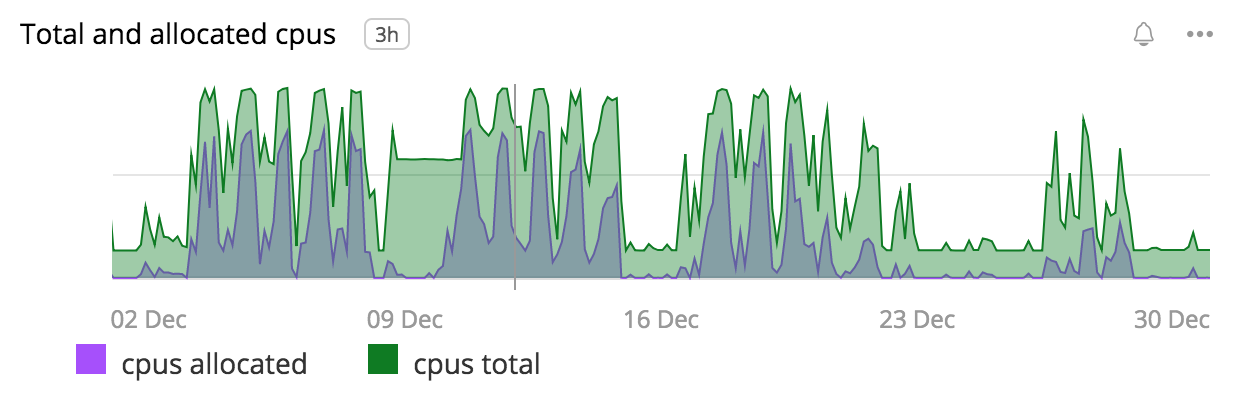
Figure 3: Cluster capacity for Jolt (our unit- and integration-testing cluster) in December 2018. The green curve shows the total CPUs in the Mesos cluster and the purple curve shows the CPUs allocated to tasks.
This graph shows some nice trends: in particular, we see that we’re almost always overprovisioned on the cluster, and moreover, starting on 9 December there’s a period where a bug in the autoscaler prevented us from scaling down. There are two main disadvantages in the above graph: first, our monitoring aggregates a lot of data points, especially for data that’s more than thirty days old; and second, we can’t provide it with “fictional” input data and ask it what the cluster would do.
Now let’s take a look at the same data as represented by Clusterman:
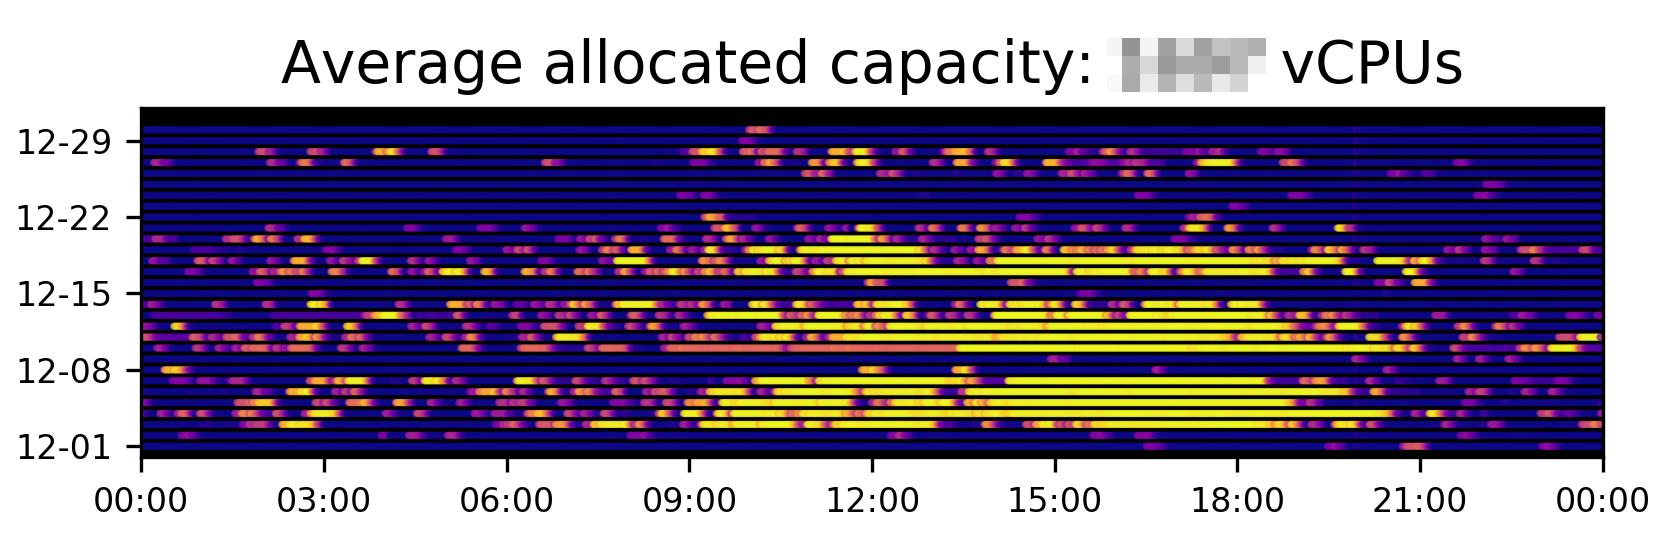
Figure 4: Actual cluster usage for our Jolt (unit- and integration-testing) workload in December 2018.
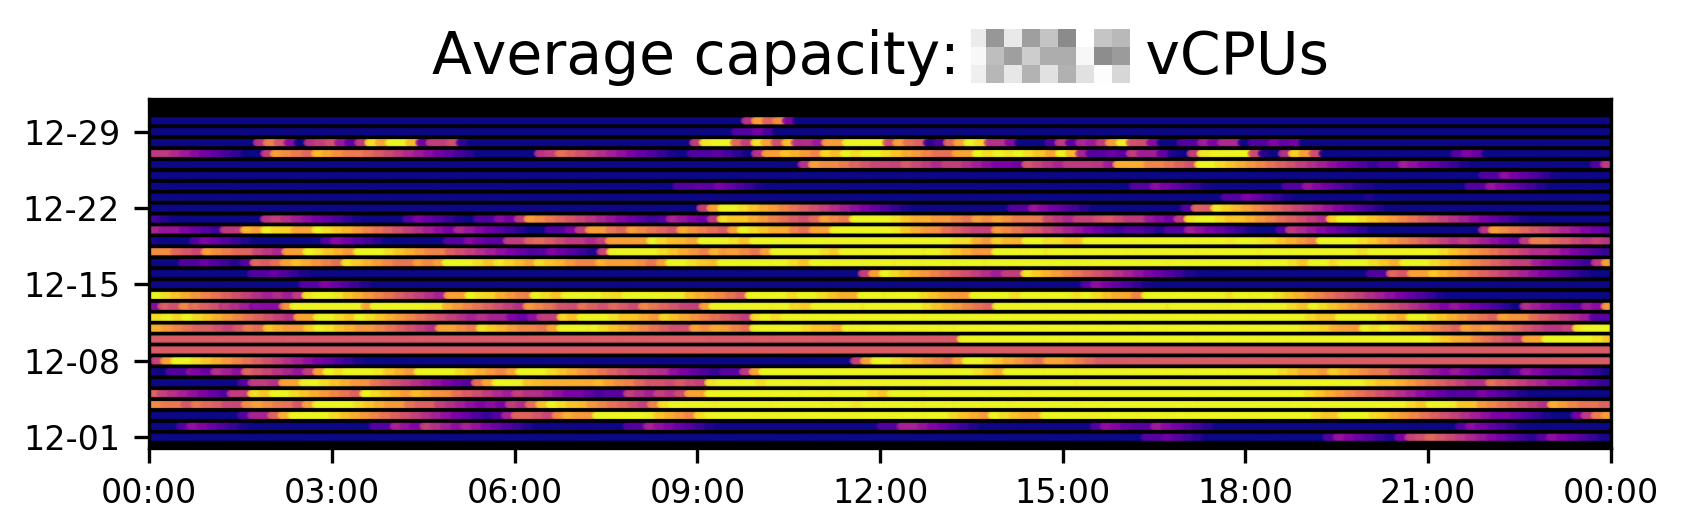
Figure 5: Actual cluster capacity (i.e., number of available CPUs) in the Jolt cluster in December 2018.
Figures 4 and 5 show the respective number of CPUs allocated by Jolt tasks and provisioned in the cluster, as reported by Clusterman for this same time frame. Each dot represents one minute of real time, and the brightness of the dot indicates a higher capacity or utilization. Clusterman’s data collection does not average or aggregate, and we store data for up to two years; so, unlike other more general monitoring tools, we can do 100% accurate simulations for events from two years ago, or compute year-over-year comparisons of usage or cost.
You can definitely see some patterns here that weren’t immediately obvious in Figure 3. For example, it’s quite clear that most people run tests during the day rather than at night (we encourage a healthy work-life balance at Yelp!). Moreover, it’s still obvious, even just qualitatively, that our cluster is overprovisioned. Finally, using EC2 pricing data from AWS, Clusterman can look at the above usage data and tell you how much you’re spending and when your costs peak. While there are lots of other tools out there with the same functionality, only Clusterman can break the costs down to a per-application level, enabling us to perform cost attribution to various teams at Yelp.
The two above graphs are based on actual data from Clusterman and Jolt. Let’s look now at a simulation to see how we might do better (or worse). Here’s an example of a really basic signal called the “Constant Signal.” As you might imagine, it always requests the same number of resources. What would happen to the above workload if we used this signal? Let’s specifically look to see how many unused CPUs we have sitting around:
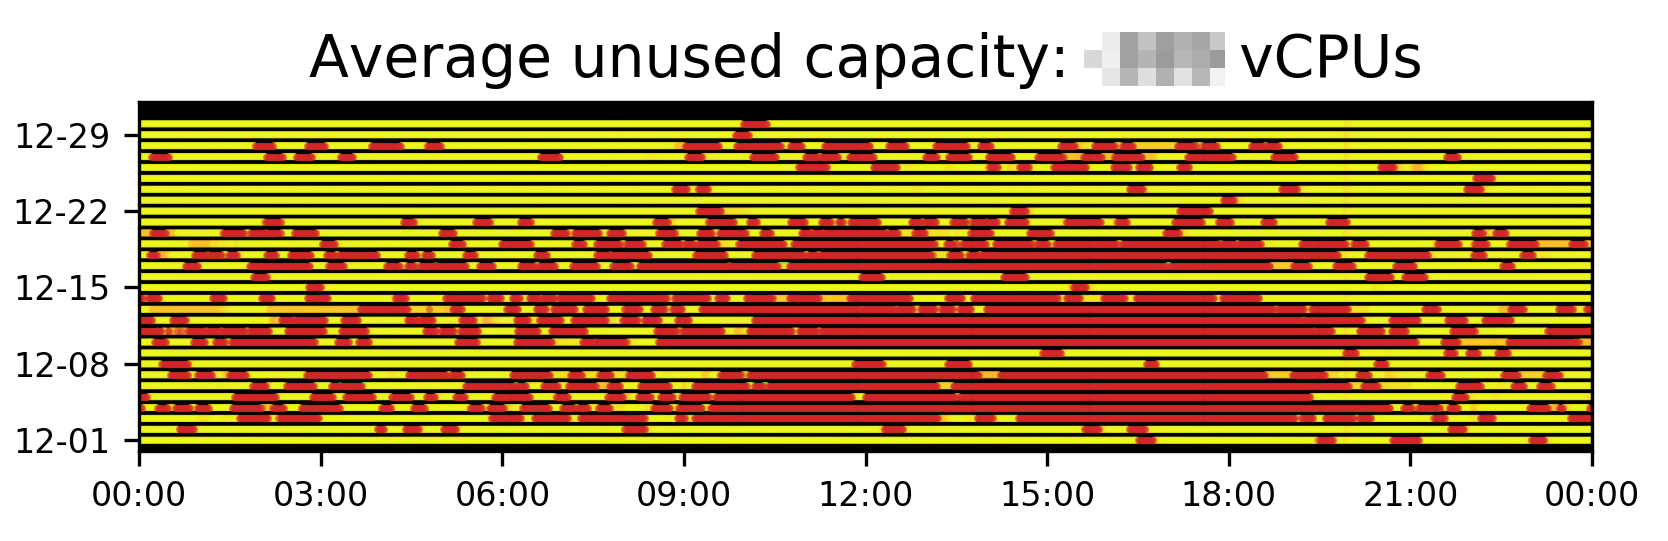
Figure 6: Simulation of what would happen if we replaced our sophisticated autoscaling signal with one that requests the same amount of resources at all times.
Oh no! What are all those red dots?? Well, based on historical utilization, we know these are cases when the number of CPUs allocated by Jolt Mesos frameworks would have exceeded the capacity of the cluster. This means that if we deployed this signal into production, we would run out of capacity practically on a daily basis, and our unit test jobs would be delayed. This might be what we want if we’re spending too much money during the day, but in all likelihood is probably a bad sign. Fortunately, this is just a simulation!
The use of this simulator has proven invaluable for our autoscaling efforts; it’s allowed us to catch several bugs that would have made it into production otherwise, and additionally has given us useful data for where to focus our cost-saving efforts. We’ve been able to translate results from our simulator into real changes to signals, resulting in around 10% cost savings (at no loss of reliability) for our Jolt cluster!
Wrapping Up: What’s next for Clusterman?
Have no fear: just because we wrote this blog post doesn’t mean we’re done working on Clusterman. We’ve got a lot of exciting things in store for the future. First up, we’re currently investing in building Kubernetes support into Clusterman. Due to its modular design, it will take just a few weeks of effort before seeing the benefits of Clusterman for free on our nascent Kubernetes clusters. We also have a bunch of improvements we want to make around the simulation interface, namely with regards to making it easier to do data analysis. Finally, we’re just scratching the surface of what we can do with our signals. We’re planning to start looking at machine learning models to better predict the incoming demand for our clusters, and balance that automagically with our cost constraints. Watch this space for more exciting info about Clusterman in quarters to come!
Become an Infrastructure Engineer at Yelp
Want to do data analytics on our infrastrucure? Apply here!
View Job