Automatically Categorizing Yelp Businesses

-
n. tung, Software Engineer
- Sep 2, 2015
At Yelp, we use categories for businesses to help determine search results, improve search relevance, inform our users of what a business does, as well as help our sales team target groups of businesses. For example, Starbucks is categorized as Coffee & Tea, and Walgreens stores are often categorized as both Drugstores and Convenience Stores.
A number of our businesses don’t have categories, but they do hold other clues which can be used to infer categories. They tend to be businesses with relatively few reviews and photos, since more popular businesses would have eventually been assigned a category by Yelp users, or our manual data curation teams. In the Impact section (down the page), we show that businesses received almost twice the number of clicks after being categorized.
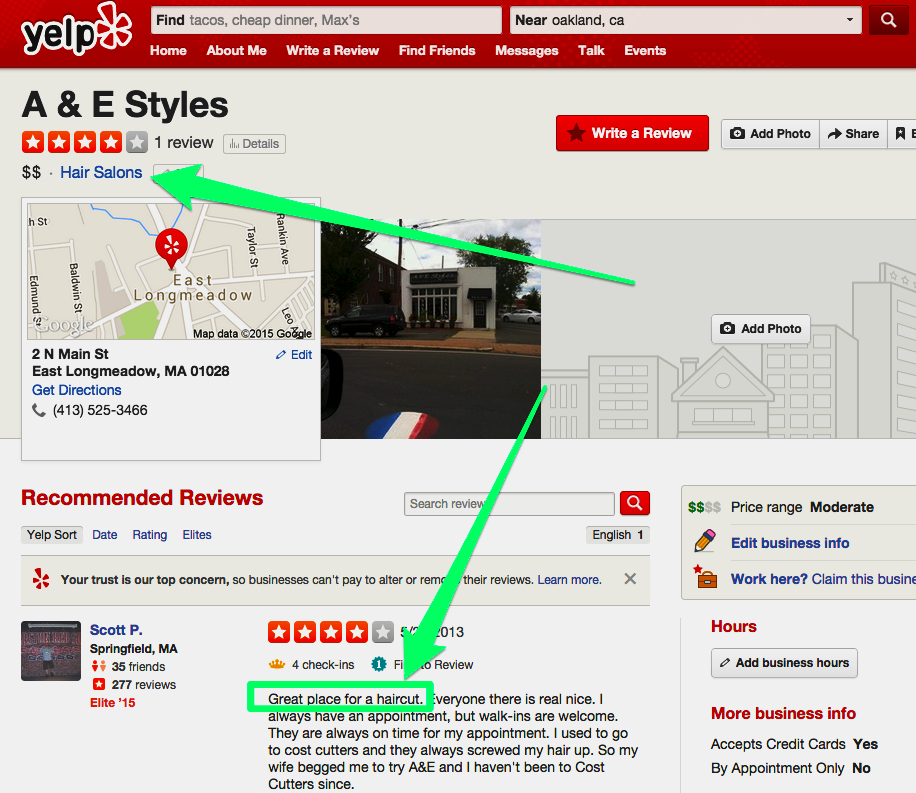
Our machine-learning system infers the category Hair Salons. In the review, you can see text like “Great place for a haircut”, which is very indicative of this categorization.
Problem statement
Given a business on Yelp, we want to assign it a set of applicable categories. Because a business can be assigned multiple categories, this is a multi-label classification problem.
Categorization is challenging because:
- We have nearly 1000 possible categories (see our category list)
- Our current categorizations (training data) aren’t perfect
- Uncategorized businesses (inputs) can be ambiguous
- The difference between some categories is subtle or ambiguous (e.g. Real Estate Services vs. Real Estate Agents)
Further, we wish to automatically apply categorizations with minimal user intervention. We are willing to trade recall for precision, i.e. assign accurate categories to fewer businesses. Typically (in our work) this is achieved by choosing confidence thresholds, which can later be adjusted, though one can also weight negative training examples more.
Classification approach
Our first attempt at categorizing businesses tried to determine the single best category for a business. This is called a “one-vs-all” multi-class classification approach. We would then try to recover multi-label classification aspects by looking at how the probability scores for each classifier fell off. For example, if a business was marked as 70% Restaurants, 20% Coffee & Tea, and the remaining 10% weight shared by remaining categories, we might try to guess that the labels [Restaurants, Coffee & Tea] should apply. This didn’t work very well, because we couldn’t distinguish between cases where:
- We weren’t sure of any categorization
- None of our existing categories matched the business well
- Multiple categories matched the business well
Not having reasonable confidences severely limited our ability to auto-apply categorizations.
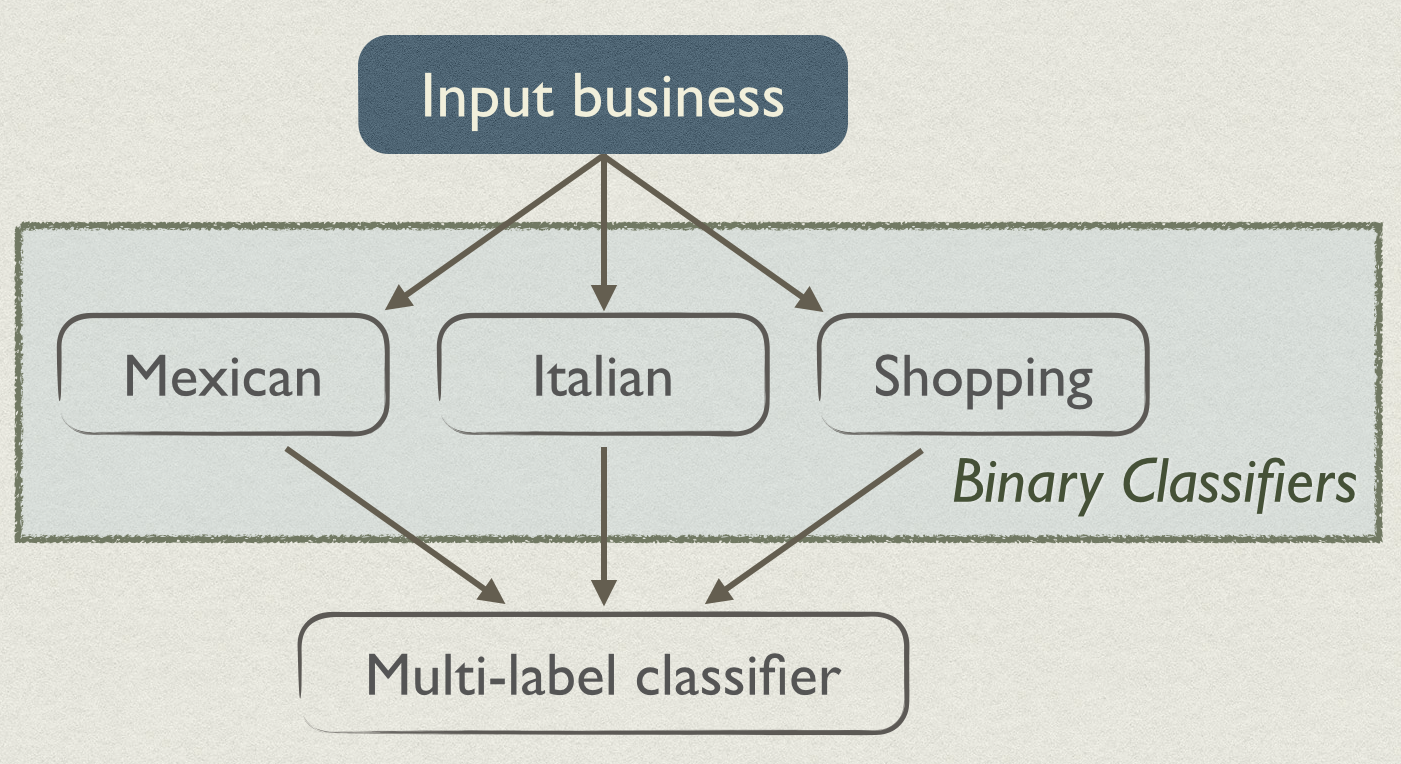
Our re-designed approach uses a series of binary classifiers: one for each category. Each classifier answers a simple question: is a business of a given category? For example, the Mexican Restaurant classifier would respond “no” to the example business above (A & E Styles), whereas the Hair Salons classifier would respond “yes”.
A naive approach could simply assign categories of the top-scoring classifiers. For example, if the Mexican and Italian classifiers both responded “yes”, those would be the new categories of the business. However, we find that using a second-level classifier, which we uncreatively call the “multi-label classifier”, is a better approach (we compare the two later).
To construct multi-label classifications, we take the 5 top-scoring categories, and consider subsets of 1, 2, and 3 categories.
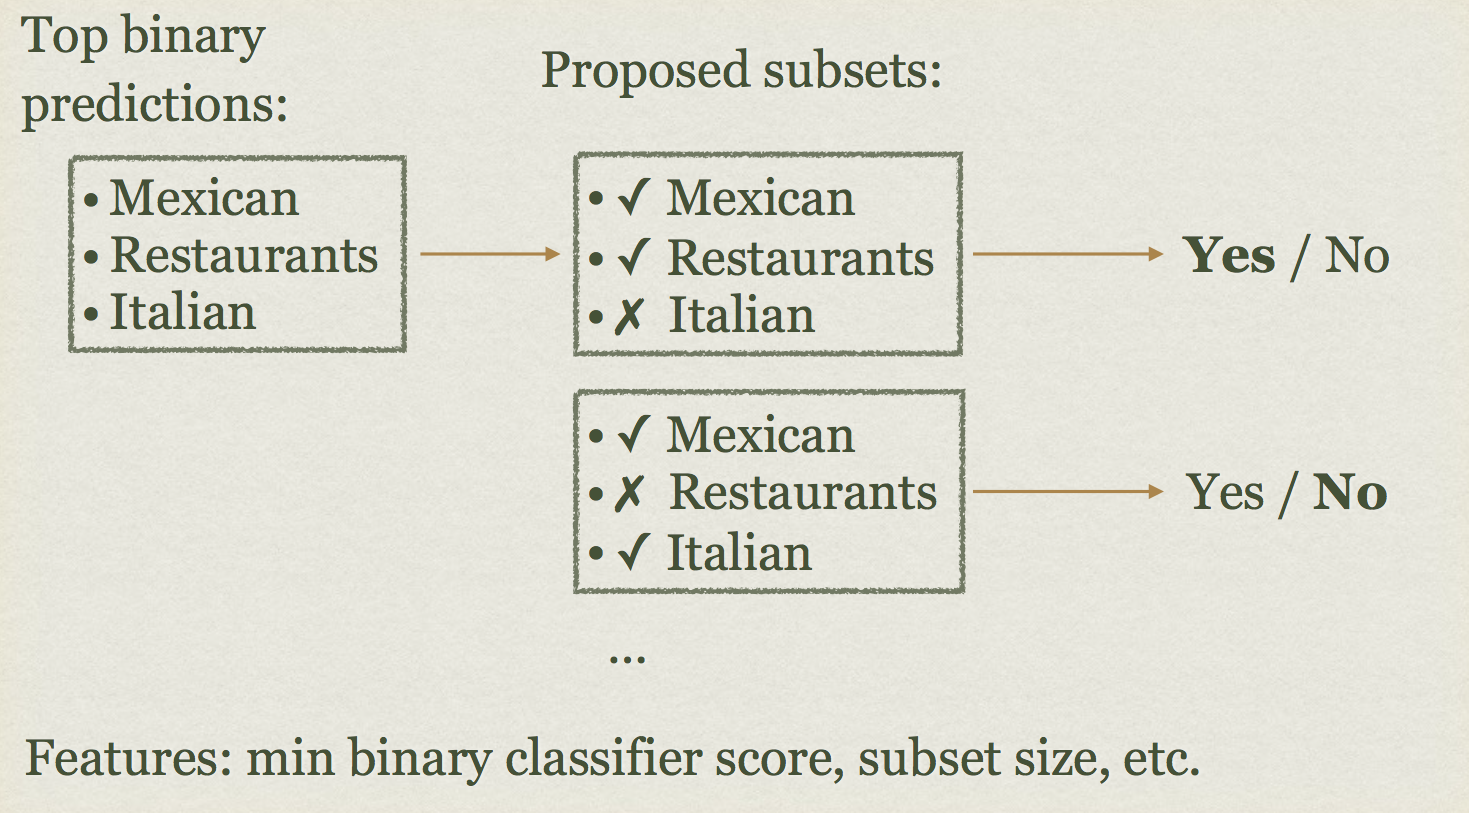
Each subset is scored by the multi-label classifier. The classifier will output probabilities that:
- The subset is wrong (includes categories that aren’t correct)
- The subset is correct but not complete (a strict subset of the correct categories)
- The subset is correct and complete (equal to the set of correct categories)
Binary classifiers: features and design
The binary classifiers use scikit-learn’s logistic regression class. These classifiers support a large number of features. We extract terms from names and reviews, using standard lexical analysis techniques of tokenization, normalization (e.g. lowercasing), and stop word filtering. If the business has been categorized as part of a chain (which we’ll describe in an upcoming blog post!) we’ll include that chain’s URL as a feature, and if the business has NAICS codes from one of our data partners, we’ll include those as well.
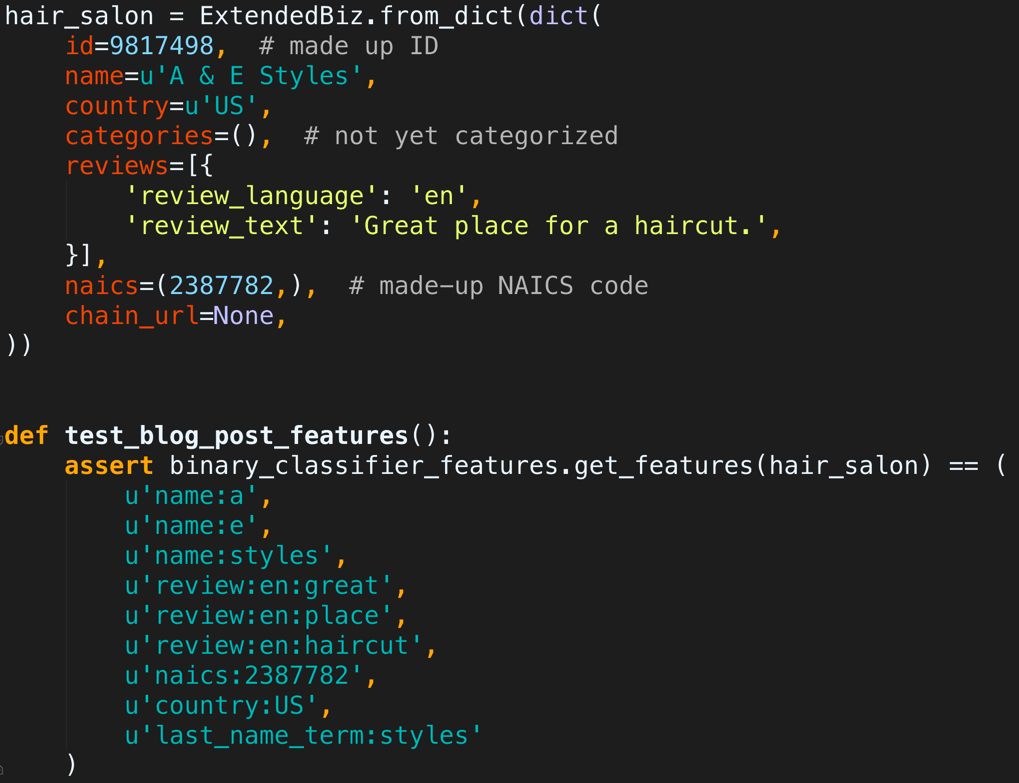
For the hair salon example above, our binary classifier will work on bag-of-words features from the name, review text, country code, and NAICS codes from data providers.
The classifier will then determine which of these features are relevant. For example, the Shopping classifier is highly correlated with businesses that have “Pharmacy”, “Dollar”, “Antiques”, or “Battery” in their business name.
Our initial design used simple unnormalized linear term frequencies, which worked well enough for classifying businesses with few reviews. However, when there are many reviews, the chance of some unrelated word being brought up in one of its 500 reviews is higher. For example, one of our Mexican businesses had a spurious review comparing it to a Tex-Mex place, which resulted in a high score from the Tex-Mex classifier. We are still in the process of choosing an effective normalization scheme (simply using scikit-learn’s TF-IDF transformer didn’t help), but have achieved good preliminary results by normalizing review terms separately, with maximum TF normalization, which divides term frequencies by the maximum term frequency.
Infrastructural challenges
While not necessary for understanding the core concepts of our system, another interesting aspect of our binary classifiers is that we are able to train good classifiers on only 400,000 businesses (or fewer, for classifiers which don’t have many positive training examples). This is nice for keeping the memory footprint and training time reasonable. However, we need to train each classifier on the most relevant examples. For example, the Mexican classifier is likely to be confused with Tex-Mex or Traditional American, but is unlikely to be confused with Real Estate Lawyers. Therefore we will show it more Tex-Mex or Traditional American examples.
We accomplish this with some clever boosting of the training data. Some very rough preliminary classifiers are trained using 30,000 input samples. We then boost negative training samples according to the formula:
p(classifier is wrong) ~ p(actual category is X) * p(preliminary classifier miscategorizes X)
This is entirely analogous to normal boosting procedures (where incorrect samples from one training iteration are used as input to the next), except that we use categories as a proxy for whether the classifier will be wrong on a sample.
To sample and join the data, we currently use Redshift. We make frequent use of
the ORDER BY RANDOM() LIMIT N trick to generate uniform samples, the RANK()
window function to select up to 3 random reviews for a business, as well as
careful sortkey/distkey use, materialized TEMP tables, and UNLOAD in parallel
without sorting. Despite the inconvenient access patterns doing this much random
sampling for so many classifiers, Redshift performs admirably, and is far from a
bottleneck. For processing data, most of the project was developed with
vimap, providing local parallelism,
but we were pushing its limits. We have begun to use Spark, to train and
evaluate all of our classifiers in parallel, and the preliminary results are
good.
Note: For practitioners, it’s worth mentioning that currently, doing
ORDER BY RANDOM() on many-column tables doesn’t perform well. Therefore, it’s
good to sample one table (e.g. the primary table) to a reified TEMP table, and
then perform INNER JOINs with distkeys on auxiliary tables.
Multi-label classifier: features and design
The final multi-label classifier uses scikit-learn’s random forest classifier. Recall that as input, the multi-label classifier operates on subsets of category labels, restricted to reasonable subsets generated from the highest-scoring binary classifiers. For example, if the highest scoring binary classifiers are [Restaurants, Mexican, Italian, Shopping], one subset we might score could be [Restaurants, Italian], but we won’t consider a subset like [Restaurants, DUI Lawyers]. Each of these subsets is scored with probabilities it is correct and/or complete. The classifier operates on features that don’t precisely specify which concrete categories are part of the subset, to make it generalize well. Denote “chosen binary classifiers” as the classifiers for categories in the subset under consideration. It will look at features like:
- The best/worst score of any chosen binary classifier on the business
- The best/worst F-scores for chosen binary classifiers (this is a metric of how good the classifiers are overall / how innately ambiguous the categories are)
- A score representing whether there are any high-scoring binary classifiers which were not chosen.
- Whether the chosen categories often co-occur (for example, it’s unlikely a restaurant is both Mexican and Italian)
Features like the last will drop a few special-case businesses, in exchange for improving overall classification accuracy. For example, a gas station convenience store known for its pizza is categorized by our system as Pizza instead of both Pizza and Convenience Stores.
The role of the multi-label classifier is pretty important. Here is a comparison to using a naive approach, that only selects binary classifiers whose score is above a threshold,
| Approach | Percent classified | All-correct precision, of those classified | Complete precision, of those classified |
|---|---|---|---|
| multi-label classifier | 69.5% | 89.3% | 12.0% |
| multi-label classifier, weighted more towards complete | 67.0% | 89.3% | 13.1% |
| Naive, 0.95 threshold | 48.8% | 75.9% | 14.7% |
| Naive, 0.97 threshold | 38.7% | 81.4% | 13.2% |
| Naive, 0.98 threshold | 31.6% | 83.6% | 11.4% |
We explain the two precision scores in detail in the evaluation section, but the upshot is that the multi-label classifier swamps the naive approach in terms of recall, while providing higher precision. Its lower percent of complete categorizations is offset by the the fact that it is making many more categorizations. As a minor detail (in the name of scientific honesty), we modified the multi-label classifier to skew it towards complete classifications, since by default it’ll be biased towards giving top-level category predictions; we hope this makes the comparison with the naive approach more fair.
We posit that in the naive approach, errors in our component classifiers can get amplified–even if each classifier only had a 0.1% false positive rate, quite often, for a given business, at least one of our hundreds of classifiers would be giving a false positive. The multi-label classifier can help correct some of these errors by examining all classifiers’ outputs.
Getting labelled data
To train the binary classifiers, we used categorized and reviewed Yelp businesses. The binary classifiers benefit from having a large amount of data, and anecdotally this matters much more than having perfectly-labeled training data. Also, for the sake of pristine evaluation, we remove any businesses in the evaluation dataset from the binary classifiers’ training dataset.
For evaluation of the binary classifiers, and the multi-label classifier (which we evaluate/train cross-validation style), we’ve gathered labelled data in two ways. The first was to take Yelp’s top-reviewed businesses, and modify them so that they reflected data to be categorized. The top-reviewed businesses are categorized very accurately, but are also way too easy: each has hundreds of reviews. So, we only used the first review (that the business ever got).
This served well for our initial evaluation, but there was another problem: our top-reviewed businesses also fell under a different distribution of categories (mostly restaurants) than new or newly-reviewed businesses. Therefore, we took a uniform sample of businesses we were trying to categorize, and used CrowdFlower to get crowdsourced labelings. A sample question would look like so:

When evaluating our system, we would sometimes see cases where it was badly wrong (e.g. assigning Auto Detailing to a boat detailing place), versus cases where it selected a secondary purpose of the business, or a related category, like Barbers instead of Hair Stylists. The inclusion of an “Unsure” option, and natural distribution of crowdsourced answers, allowed us to analyze these cases separately. The downside of using CrowdFlower was that its users, unlike our manual data curation teams, are not as familiarized with the peculiarities of our category tree, and not as invested in giving precise answers.
Our current gold dataset contains 5000 of the modified top-reviewed businesses, and 3800 CrowdFlower-labeled businesses.
Evaluation
We evaluated binary classifiers and the multi-label classifier separately. The binary classifiers differed widely in their accuracy. Some categories, like Local Flavor and Ethnic Food, are relatively ambiguous, and their application to businesses isn’t uniform. Most classifiers for top-level categories performed well, achieving F0.1 scores around 0.95 and AUC scores around 0.97.
In a previous (2011) blog post, we evaluated Naive Bayes classifiers on a sample of businesses, that was easier than our current gold dataset. The previous system achieved around 80% accuracy (between 75% and 88%). On our current gold dataset, our new Autocategorizer achieves around 96% accuracy (between 88% and 99%). Our specific per-category results are:
| Category | Accuracy |
|---|---|
| Automotive | 98.5% |
| Health | 99.1% |
| Home Services | 96.7% |
| Real Estate | 98.8% |
| Restaurants | 87.9% |
| Shopping | 95.6% |
We hypothesize that the Restaurants classifier having significantly lower accuracy is in part accounted by the ambiguity between Restaurants and Food categories in our category tree.
On our current settings, the multi-label classifier returns confident results for 70% of the businesses in the gold dataset. Of these, the classifications are correct 90% of the time (recall “correct” means the predicted category set is a subset of the gold category set). However, when we factor in ambiguity of our category tree, we typically find that it gives acceptable results 95% of the time (that it gives a confident result). The multi-label classifier optimizes for precision of its output, but we manually bias it back towards more interesting categorizations; currently, 45% of our categorizations feature a non-root category, and around 10% are complete.
Impact
We’ve been able to successfully categorize approximately 65% of uncategorized businesses that have at least 1 review in the US, Canada, and the UK. This has been a significant benefit to our Sales team, increased traffic for those businesses, and provided our users with more relevant results. To quantify the impact on search relevance, we found that the click-through volume from search to a business nearly doubled after being categorized, for US businesses.
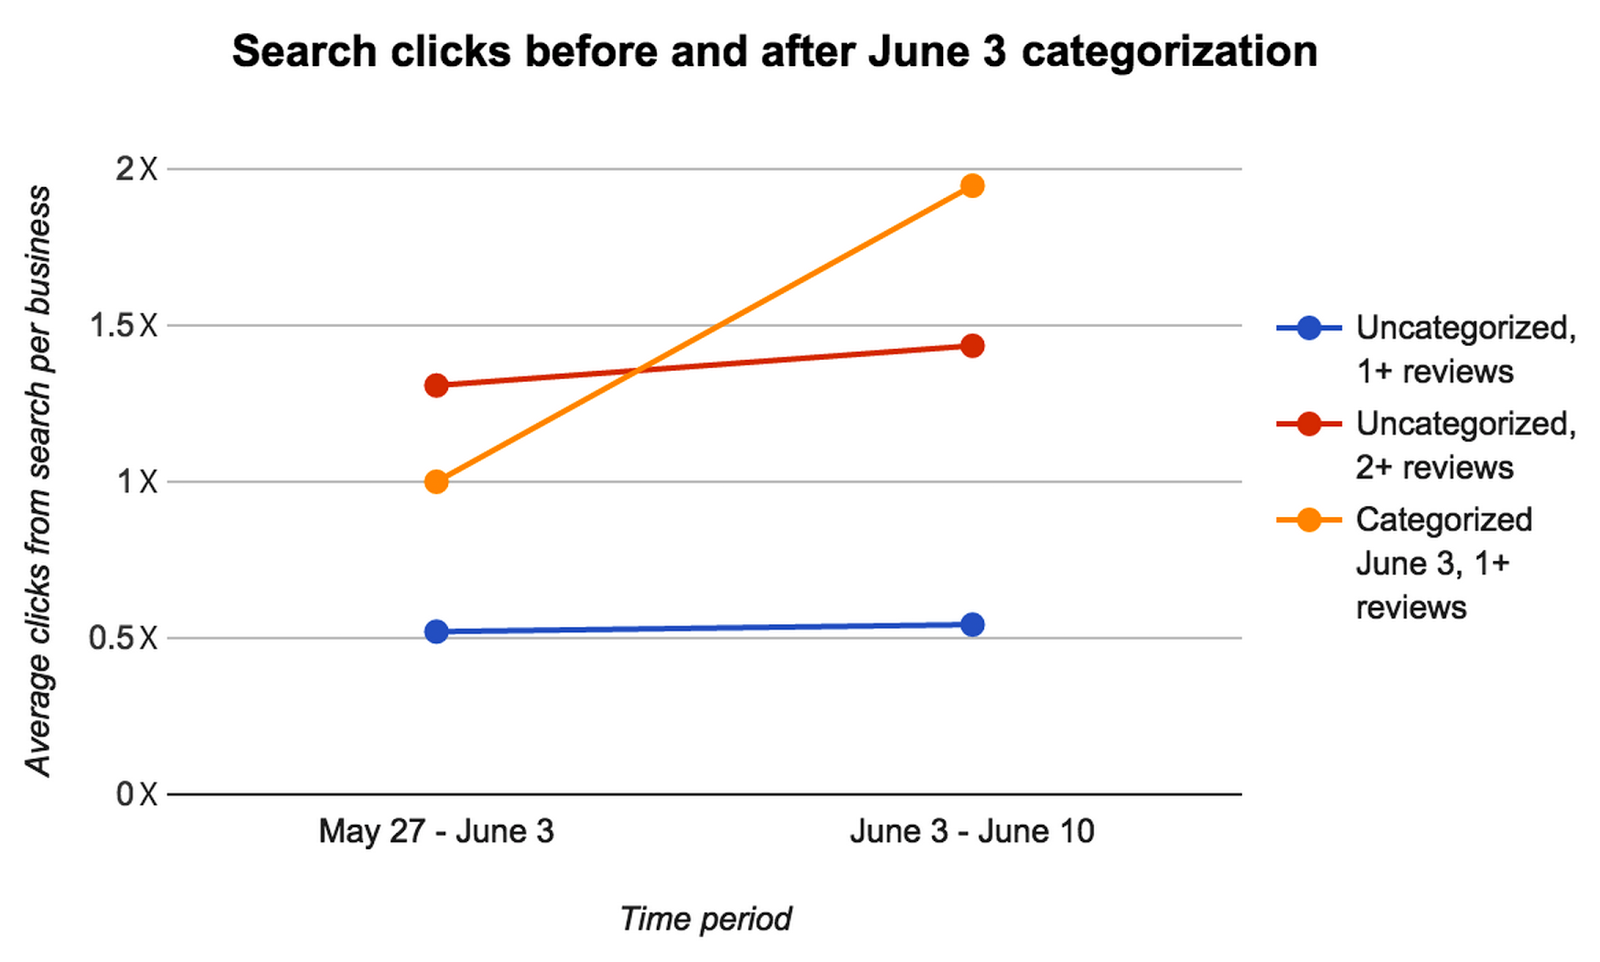
The orange line shows that after categorization, businesses received approximately twice as many clicks (on average). The blue and red control lines, representing businesses which were not categorized, show that this change is due to categorization, instead of extraneous factors, like increased overall traffic or faulty metrics. (We abstracted the exact number of clicks, since that is non-public information.)
We also categorize about 1-2% of businesses in the US with no review text, should they have a strongly-indicative name. We hope that eventually this number can double, but for now, we are starting with the most confident categorizations.
Future Work
We wish to increase the impact of this project by:
- Correcting categories on businesses. Review vector normalization experiments are yielding good quality output. We may also want to remove bad categorizations.
- Categorizing businesses in non-English-speaking countries. There is sometimes an issue of data sparsity, but preliminary findings are promising.
For improving classifier quality, we want to:
- Add features by scraping individual websites of businesses
- Improve interpretation of review text with unsupervised models (e.g. topic modeling), and possibly basic translation models (e.g. dictionaries) for foreign languages.
We also want to maximize the impact of this project by showing less-confident category suggestions to either Yelp users when they add or edit businesses, or our human data curation team. These suggestions may not be good enough to auto-apply, but they are often much better than searching through our large list of categories for the appropriate one.
We hope our automatic categorization project will ensure Yelp businesses have the most accurate categories possible, and that our users can use this information to better discover great local businesses!
Become a Data-Mining Engineer at Yelp
Interested in using machine learning to improve Yelp's data? Apply to become a Data-Mining Engineer at Yelp.
View Job