ElastAlert: Alerting At Scale With Elasticsearch, Part 2

-
Quentin L., Software Engineer
- Mar 23, 2016
It’s 10:51 PM on a Friday, and someone on the internet has decided to try to break into your network. They are guessing passwords and generating failed login events. Your security team is paged, the attacker is blocked, and everyone can go back to bed. This is one example of the power of ElastAlert. Now we’ll give you background on how it works and how to set it up yourself.
In part one of this blog post, we introduced an open source alerting framework for Elasticsearch which allows you to match and take action on a wide variety of patterns. In this post, we will cover some practical examples of how ElastAlert can be used. Note that some of these examples may not be useful in all environments, but rather they are to show some of the capabilities of ElastAlert.
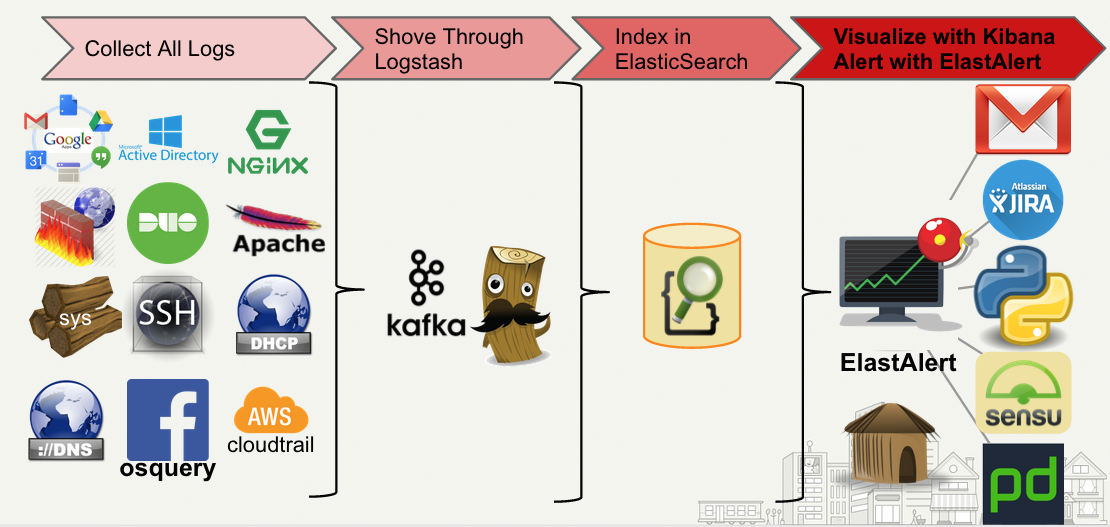
We’ll give a quick overview of our Security Information and Event Management system to provide some context to these examples. It starts off with a multitude of data sources, web requests, syslog from all of our machines, and pretty much anything any developer wants to log. We use a combination of Logstash, Kafka and our existing log infrastructure to parse all of this data and index it into Elasticsearch. Once it’s in Elasticsearch, we can search through, analyze, and monitor it with ElastAlert.
In many of these examples, we will omit the alerting configuration and focus on the pattern and rule type configuration. The alert itself can be customized a number of ways to suite your needs. In fact, several new alert types have been added since the last post: AWS SNS, HipChat, Slack, PagerDuty, Telegram, and VictorOps. For information on how the alert section is set up, please consult the documentation.
SSH and Other Logins
Let’s start off with a simple rule to alert us whenever a failed SSH authentication occurs. We will assume that the log _type is ssh and that it also contains an outcome, success or failure, and a username.
# Alert when any SSH failures occur
filter:
  - term:
      _type: ssh
  - term:
      outcome: failure
type: any
The any type will alert on any document which matches the filter. Maybe this would generate too many alerts. We can change the type to frequency to only alert if multiple SSH failures occur. We can refine it further by using query_key to group the events by username. This will allow us to alert only if a certain number of failures have occurred for a given user.
# Alert when 10 SSH failures occur for a single user
filter:
  - term:
      _type: ssh
  - term:
      outcome: failure
type: frequency
num_events: 10
timeframe:
  hours: 1
query_key: username
This will alert you if someone is trying to brute force an SSH login, but what if an attacker has already taken your credentials? There are a few other things we could look at such as has the same user connected from multiple IP addresses?
# Alert when a single user has connections from 2 IPs
filter:
  - term:
      _type: ssh
  - term:
      outcome: success
type: cardinality
max_cardinality: 1
cardinality_field: ip_address
timeframe:
  days: 1
query_key: username
In this example, we are alerting if the cardinality of the ip_address field, grouped by username, is greater than one within a day. This specific alert could also be accomplished using the change rule type, but cardinality gives you more flexibility and could be used for a variety of other purposes.
Error Logs
ElastAlert can be very helpful for trying to make sense of things like error logs. We’ll assume that error messages are parsed in such a way that they contain an error_type. You could use type: any and alert on every single error message. However, this might not scale well. You might only care about “has the number of errors spiked?” Often, setting an explicit threshold is hard, as baseline normal may vary over time. To handle this, we can use the spike type.
# Alert if number of errors triples in an hour
filter:
  - term:
      _type: error
type: spike
spike_height: 3
spike_type: up
threshold_ref: 10
timeframe:
  hours: 1
top_count_keys:
  - error_type
With this rule, we are comparing the number of errors in the last hour with the hour before that. If the current hour contains more than 3x the previous hour, and the previous hour contains at least 10 events, it will alert. If this is too sensitive, increasing the timeframe would effectively smooth out the average error rate. By setting top_count_keys, the alert will contain a breakdown of the most common types which occurred within that spike. If our errors also had a URL associated with them, you could group by that, and alert only if a large number of errors occurred for a single URL.
This is all well and good if we don’t care about common errors sending us alerts, but critical error messages could still sneak by. Another approach we could take is to send an alert only when a new, never before seen, error message occurs.
# A new error type occurred
filter:
  - term:
      _type: error
query_key: error_type
type: new_term
include:
  - traceback
Service Monitoring
ElastAlert can be very useful for monitoring the health of hosts and services. In these examples, we will assume there is some service, hosted on multiple machines, which logs requests and response codes.
Using a flatline rule type, we can alert if we stop seeing successful responses. By grouping the hostname, we can get an alert if just a single host stops.
# Alert if a host stops serving 200 responses for an hour
filter:
  - not:
      range:
        response_code:
          from: 500
          to: 599
type: flatline
threshold: 1
timeframe:
  hours: 1
query_key: hostname
With this rule, we allow new hosts to be added to the server pool and they will be automatically monitored. You could also modify the filters such that a “healthy” response is a range of status codes.
Another thing we could look at is timing. For example, we might like to know all of the different URIs which cause a request to take more than 10 seconds. We can create an alert which will send a report of all requests which occur during a week which take this long.
# All requests in a week which took over 10 seconds
filter:
  - range:
      response_time:
         from: 10
type: any
aggregation:
  weeks: 1
include:
  - ip_address
  - hostname
  - uri
  - response_time
These are just a few possible use cases. With custom rule types or alerts, anything is possible. If you can get it into Elasticsearch, you can monitor and alert on it. For a full list of features, as well as a tutorial for getting started, check out the documentation. Source can be found on Github. Pull requests and bug reports are always welcome! If you have any questions, jump into our Gitter channel.
Securing The Yelps
If you're interested in building tools like ElastAlert that help us secure Yelp and its users, apply to become a Software Security Engineer
View Job