Yelp Dataset Challenge is Doubling Up!

-
Soups R., Ph.D., Software Engineer (Data Mining)
- Feb 6, 2015
Two years, four highly competitive rounds, over $35,000 in cash prizes awarded and several hundred peer-reviewed papers later: the Yelp Dataset Challenge is doubling up. We are proud to announce our latest dataset that includes information about local businesses in 10 cities across 4 countries. This dataset contains 1.6M reviews and 500K tips by 366K users for 61K businesses along with rich attributes data (such as hours of operation, ambience, parking availability) for these businesses, social network information about the users, as well as aggregated check-ins over time for all these users. This treasure trove of local business data is waiting to be mined and we can’t wait to see you push the frontiers of data science research with our data.
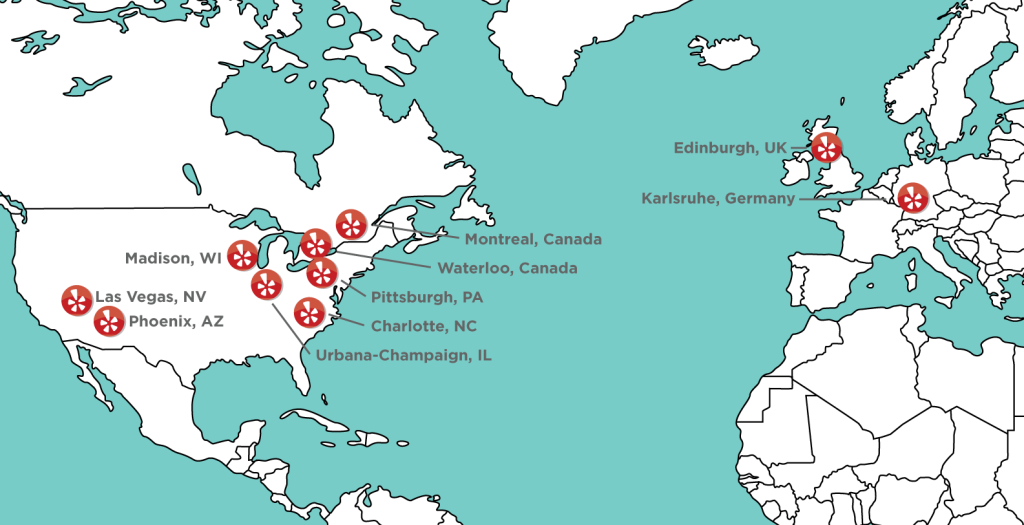
Figure 1: Cities included in the Yelp Dataset Challenge Round 5
At Yelp, one of our missions is to engage with the academic community and help them by providing real-world data to aid their research. Our dataset should appeal to researchers in data mining, machine learning, economics and urban planning alike. So whether you are building a cutting-edge Natural Language Parsing (NLP) algorithm that mines sentiments expressed by our reviewers, figuring out what business attributes (service quality, ambience, etc.) make a local business popular, or designing better cities and communities by mining local business data – our dataset has everything you need to put your research together.
New Competition: Deadline is June 30th 2015
Download the new dataset and remember to submit your entry by June 30, 2015 in order to be eligible for one of our top-project prizes of $5,000. Please note that the contest itself is open only to students. The contest will run from Feb 5, 2015 to June 30, 2015. See the website for the full terms and conditions.
New Dataset: 10 cities, 4 countries
The most recent Yelp Dataset Challenge ( our fourth round) ran from August 1 – Dec 31 2014, giving students access to reviews and businesses from five cities worldwide: _ Phoenix, Las Vegas, and Madison in the U.S., Waterloo in Canada and Edinburgh in U.K. _.
In Round 5, open now, we are expanding the dataset to include data from five new cities: _ Pittsburgh, Urbana-Champaign, and Charlotte in the U.S., Montreal in Canada and Karlsruhe in Germany _. We have also updated the data from the original five cities with any businesses that were added or new reviews and tips that were written in those cities since August 1, 2014.
To get your creative juices flowing, here are a few things that you could do with this dataset and some interesting projects from the last round:
Cultural Trends
By adding a diverse set of cities, we want participants to compare and contrast what makes a particular city different. For example, are people in international cities less concerned about driving in to a business, indicated by their lack of mention about parking? What cuisines are Yelpers raving about in these different countries? Do Americans tend to eat out late compared to the Germans and English? In which countries are Yelpers sticklers for service quality? And what about that old adage: is success of a business just location, location and location?
Seasonal Trends
What about seasonal effects: Are HVAC contractors being reviewed just at onset of winter, and manicure salons at onset of summer? Do you see any non-intuitive correlations between business categories e.g., how many karaoke bars also offer Korean food, and vice versa? Are there more reviews for sports bars on major game days and if so, could you predict that?
Natural Language Processing (NLP)
What are the most common positive and negative words used in our reviews? Are Yelpers a sarcastic bunch? And what kinds of correlations do you see between tips and reviews: could you extract tips from reviews? In international cities such as Montreal, are French speakers reviewing places differently than English speakers?
Some creative projects from Round 4:
We are still in the process of reviewing the submissions from Round 4. The response has been overwhelming and we have received over 60 well thought-out and insightful submissions. Yelp’s team of data mining engineers is still reviewing the submissions to decide the winners of the grand prizes. Meanwhile, we thought we’d share a few interesting submissions.
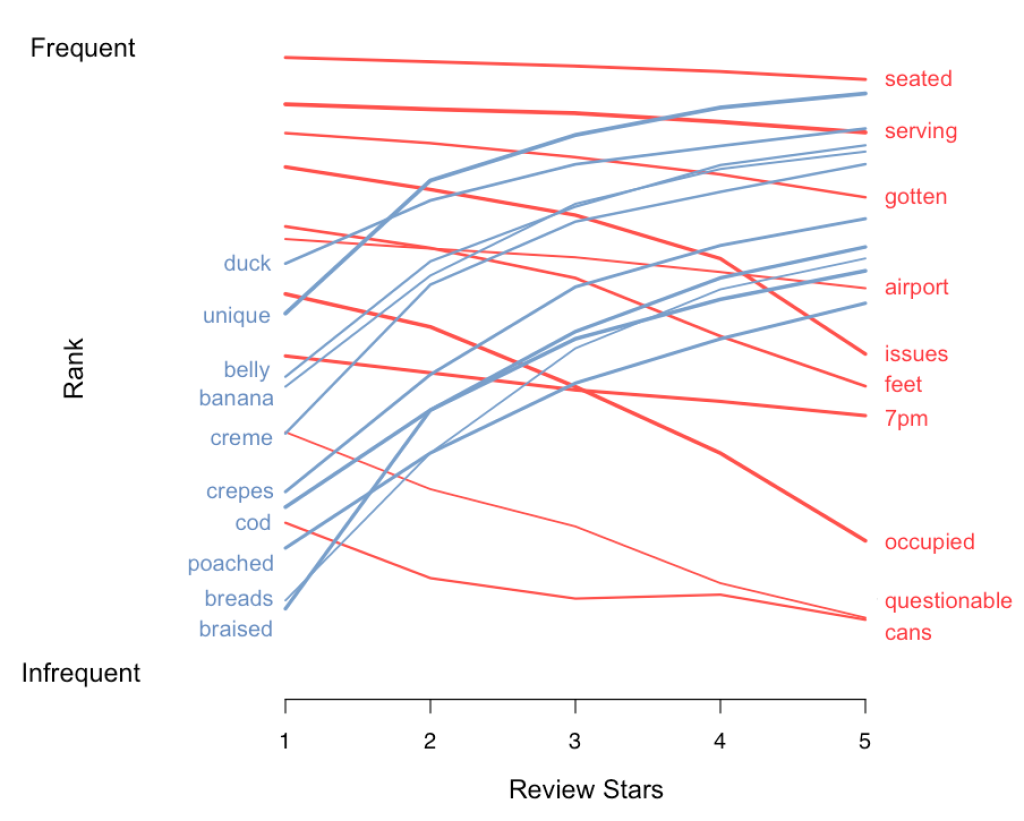
Figure 2: Good Food Bad Service Restaurants
A team of Stanford Data Science majors mined our review dataset to identify the characteristics of restaurants that are consistently ranked for their good food, but bad service. If you live in Phoenix, Las Vegas, Madison, Waterloo or Edinburgh, then you can check out these Good Food Bad Service Restaurants they’ve identified. For instance, the words in blue above are those that are mentioned more often in 5-star reviews than in 1-star reviews, e.g., “duck,” “cod,” “poached,” and “crepes.” In contrast, “airport,” “occupied,” “issues,” “serving,” and “7 pm” are words used much more often in lower rated reviews. Their recommendation to “Good Food Bad Service” restaurants: hire more wait-staff for the 7 pm rush!
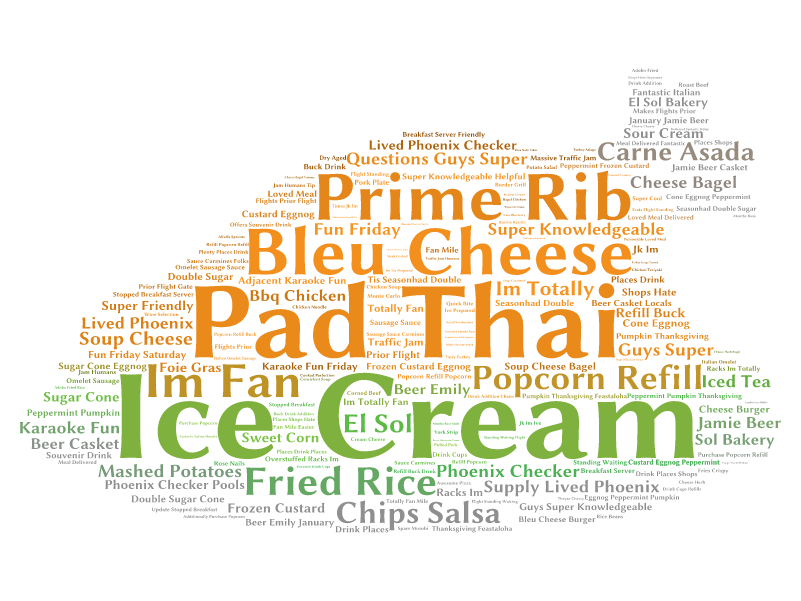
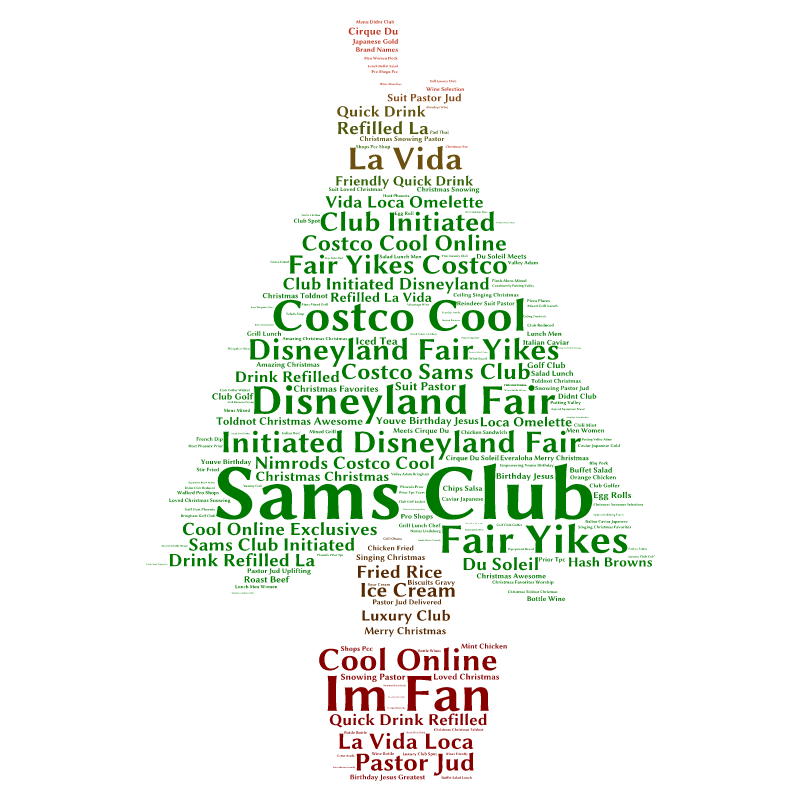
Figure 3: Thanksgiving is all about food while Christmas is about shopping!
Data Science Society of UCSD wrote up a very interesting blog post describing Naïve Bayes and Random Forests based approaches towards predicting star rating of users solely based on the content in their reviews. They also created some beautiful word clouds to visualize what Yelpers like to do during the holidays. It turns out Thanksgiving is all about food while Christmas is all about shopping!
So go ahead and take our data for a spin. We can’t wait to see what you create!