Know Thyself: My Internship Quest to Build a Framework to Analyze Our Yelp Feed

-
Arthur J., Software Engineer Intern
- Jul 31, 2015
Over the years Yelp has built cool integrations with partners such as Apple, Microsoft, Yahoo and many others that have enabled users to interact with our rich dataset in unique ways. One of the methods we’ve used to achieve these integrations is by building a robust, scalable data feeds system, which contains information for over 50 million businesses.
As we allow partners to have their own configurations, information included in these feeds may vary from one partner to another and we did not have an easy way to access the history of data feeds that were delivered to our partners. Having the ability to explore our data feeds is crucial as it allows us to perform quality assurance, pick up on trends and enable us to make future business partnership decisions.
Such insights into our feeds would allow us to answer questions like:
- How many of the business listings we sent to partner-A yesterday were merged into other business listings because they were duplicates?
- Is it true that a business listing we sent to a partner has actually been closed since last Saturday?
- How many business listings in the US don’t have phone numbers specified on them? As you can imagine, the answers to these questions could be critical for partners consuming this data and could also help us catch bugs in our feed generation process.
This problem statement fascinated me, and I got a chance to implement a solution for this as my intern project this past spring. Since this was a new system, I had a lot of freedom in its implementation, and after researching the various available options and evaluating their tradeoffs, I decided to use ElasticSearch, Kibana, ElastAlert (Yelp’s open source project), Amazon S3 and Amazon EMR.
Architecture
The main objective of this project was to build a visualization system on top of our data feeds. The most important piece was to choose a visualization tool that is easily navigable and has enriched functionality, and there are many visualization tools that can output data in a graphical form. At the beginning of the project, we considered either Kibana, Redash or Grafana, all have their pros and cons. We decided to use Kibana because it provides us with 11 different types of graphs, flexible filters and simple queries. Redash and Grafana are also good visualization tools but are not suitable in our use case. For example, Redash has great support for using arbitrary and complex queries on a desired data set but, in our project, it would have introduced the overhead of maintaining queries for more than 25 partners with 13 different graphs individually (325 queries in total).
By using Kibana, it was a natural choice to use an ElasticSearch cluster as our backend data store for the feeds. Yelp has an internal ElasticSearch cluster template which allowed us to easily spin up our own cluster for this project on AWS.
Before spinning up a new ElasticSearch cluster, we had to estimate how much data we could afford to store. This estimation is important for two reasons - we want to optimize the monetary cost of provisioning AWS machines and we want to optimize Kibana’s efficiency in visualizing the data. We estimated at least 45GB of new data per day, a representative subset of our overall feeds. We decided to go with a one month retention policy along with one replica for each shard. With this setup, we would index roughly 111M documents every day. These calculations led us to choose three dedicated master nodes and 5 data nodes, master nodes would use m3.medium and data nodes would use c4.8xlarge AWS machines.
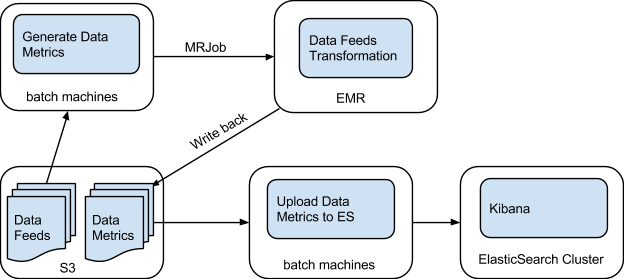
Now that the architecture and configurations were decided, I went on to implement a two-step workflow to import these data feeds into the newly provisioned ElasticSearch cluster.

The first step takes data feeds generated by the Feeds system (which dumps its output to S3) from S3 and uses our MRJob package to initiate an EMR job. This cycle, called Data Feeds Transformation, aims to retain only necessary information from data feeds. The results, data metrics, will be uploaded back to S3 from EMR. The second step reads these data metrics from S3 and then dumps them to the ElasticSearch cluster.
This two-step process is applied to each individual partner that we generate feeds for.
Problems
As mentioned earlier, the feeds system is highly customizable and gives partners a lot of freedom to select what information they want to receive. Every partner has its own configuration that controls the output of its data feed. These configurations are specified through our own DSL that uses YAML as its representation. Data feeds are generated by applying these partner configurations to our underlying source data. For each configuration, it explicitly states what information to keep and what operations to perform.
For example, a snippet of partner configuration in YAML format can look like:
Given the above configuration, the data feed for the partner will be structured like:
This data feed includes the city and state information for the given partner. Notice that the field changes to ‘state’ from ‘state_code’ inside of the location structure as a ‘_rename’ operation has been applied on that field.
Besides rename operation, there are other operations that can be performed, such as flattening addresses. Some partners choose to have operations on certain fields, whereas some choose not to. Data feeds will have different structures and different fields depending on the selected operations.
As a result, our feed data is not uniform across partners. This makes it hard for us to visualize them on the same scale, or even analyze them for the same patterns. Thus, we had to build a generic workflow that is capable of processing every data feed and bring uniformity to the final data metrics. In order to bring back uniformity, I expanded on the same DSL to define operations that would essentially reverse the effect of the partner-specific transformations, bringing all partner feeds into a uniform format.
Once we generate this unified format, we can easily apply another configuration to filter what we need to get the final data metrics.
Monitoring
Once we got our data metrics into ElasticSearch, we wanted to have a way to monitor our data. We used ElastAlert to notify us if any of the metrics at any given time has spikes or any anomalous patterns that we have defined.
For example, we implemented an alert to check if the number of businesses sent to any partner drops or increases by 10% from one day to the next. This can help us to detect any possible problems with our feed generation service immediately.
A snippet of our rule configuration is below,
In the configuration, we simply specified the type of rule in the ‘type’ field. Each rule has its own required fields to be configured. In our case, ‘spike_height’, ‘spike_type’ and ‘timeframe’ are mandatory in ‘spike’ rule type.
In addition, we configured our rule to trigger an alert when the given condition is met. The ‘alert’ field allows us to specify an alert type. ElastAlert is integrated with two default types of alert - Email and JIRA. Users can also create their own alert types. The snippet above shows a use case of our customized Sensu alert.
If you are interested in using the ElastAlert for your project, a more complete walkthrough of ElastAlert can be found here.
Results
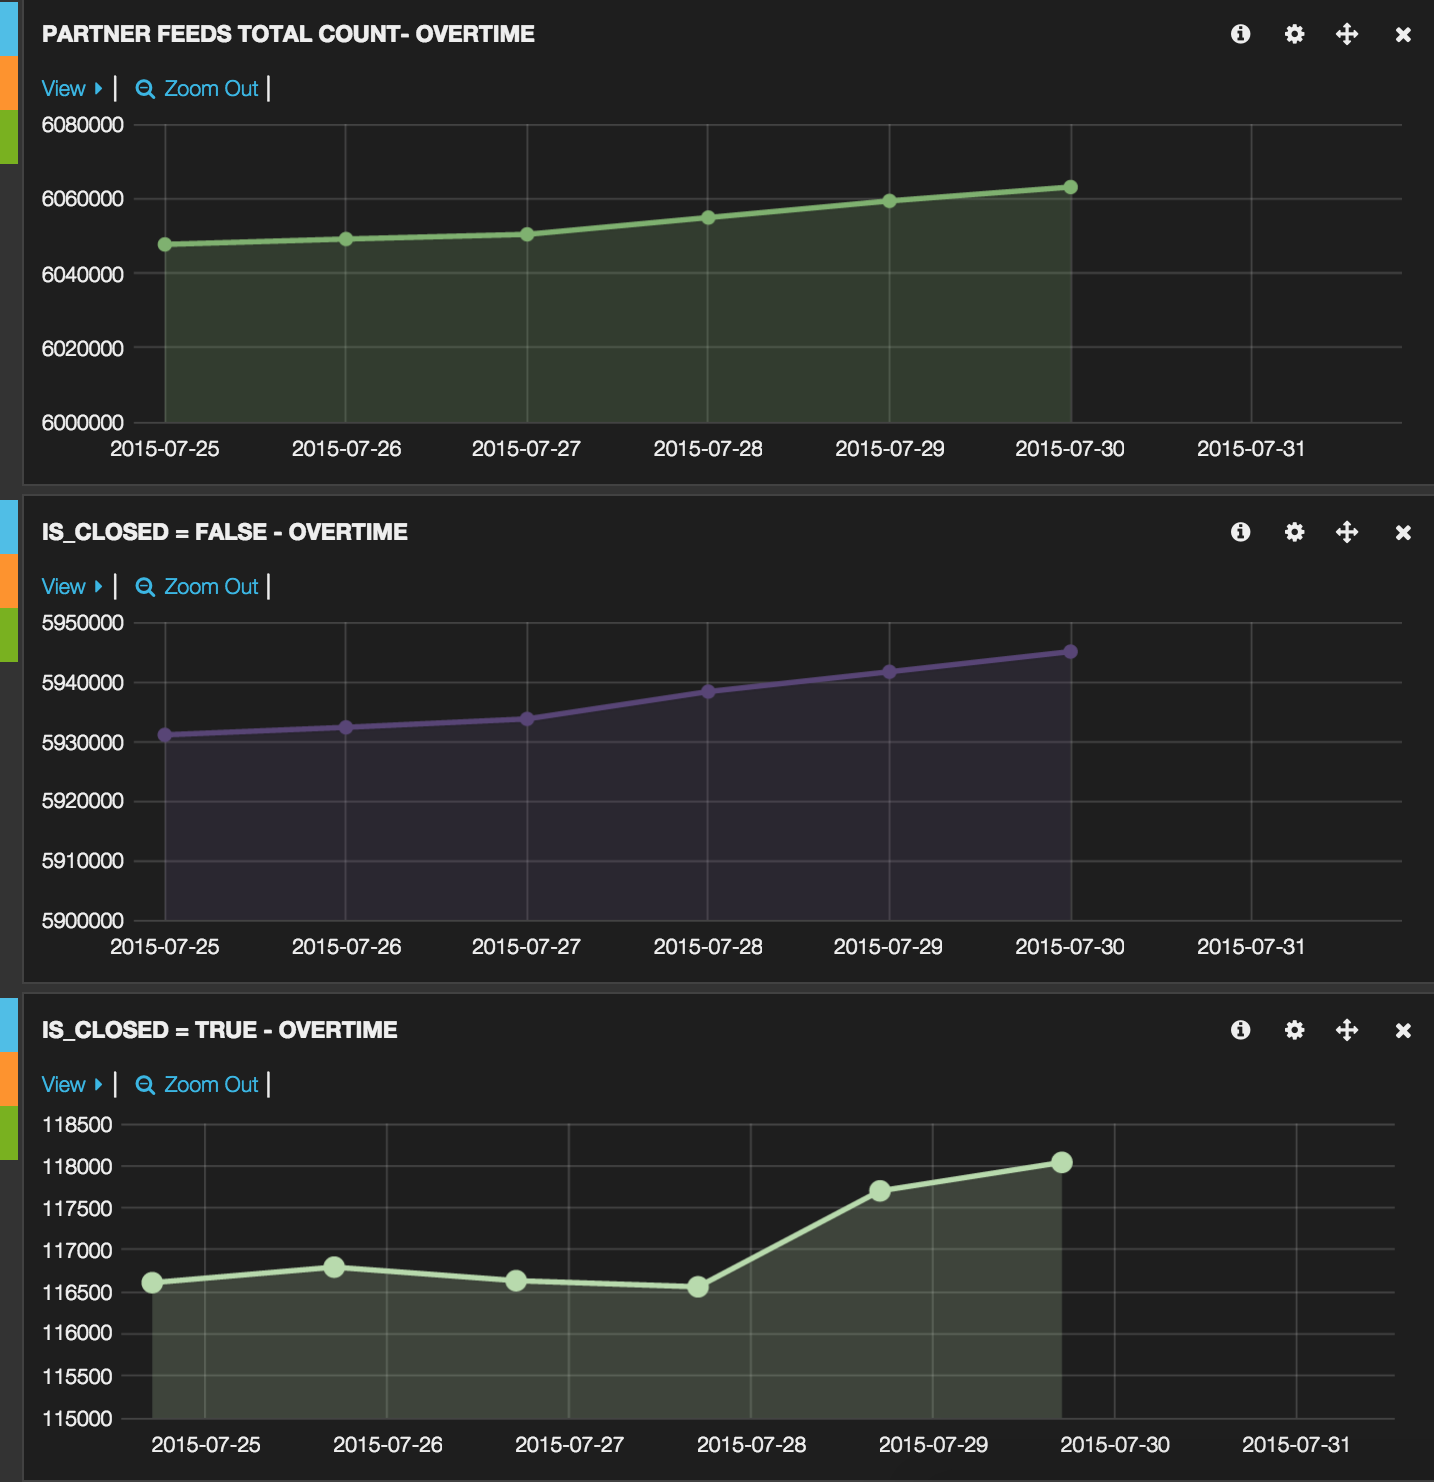
This Feed Metrics system that we built has been online since April of 2015. Below is part of the configured dashboard showing one partner with fake numbers. The upper histogram shows the total number of business counts we sent to a subset of our partners in the last seven days. The lower chart shows the number of businesses that are closed or not closed. With the dashboard, we can easily navigate through all the preconfigured graphs to visualize daily data feeds. In addition, we are able to perform numerous quality assurance operations by using preconfigured filters and queries on data we are delivering.
