iPhone vs. Android: What Does Your Phone Say About You?

-
Sebastien C., Data Scientist
- Aug 7, 2015
It’s the battle of our generation - iPhone vs. Android - and Yelp has some novel data on what makes these devices different. Users of both are aligned in their passion of using Yelp to find restaurants as well as nightlife, plumbers and even dentists. However, when we dug into the search queries, some interesting differences were revealed - some stereotypical (brunch, Starbucks, cheap, luxury, whole foods/organic), some not so much (beer vs. wine, ramen vs. steaks). Regardless of the differences, we discovered some things for certain: everyone loves sushi, pizza, and delivery of all kinds!
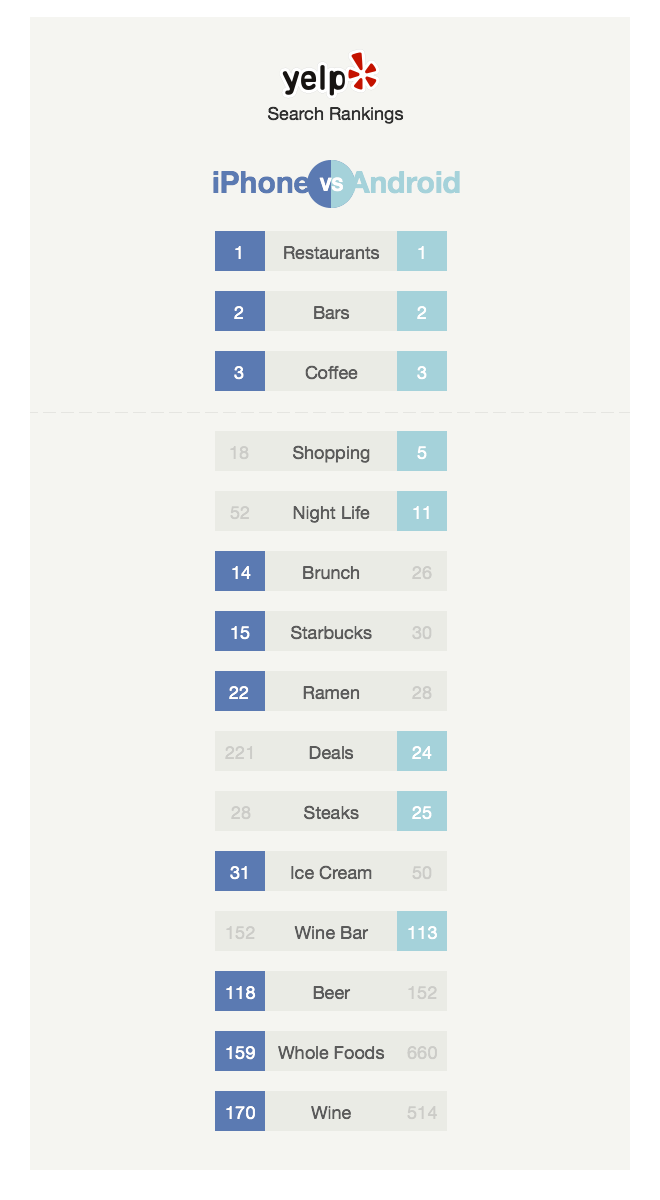
Let’s start with a few similarities. On both iPhone and Android, food terms are by far the most searched terms. “Restaurants,” “bars,” “coffee,” and “food” account for a good amount of all searches on iPhones, based on a study we did of the past 6 month’s search queries globally. The first explicitly “non-food” item is “shopping” on Android (ranked number 5) as well as on iPhone (ranked number 18). The most searched drink on both systems is “coffee.” Surprisingly, “beer” appears only at number 118 on iPhone and 152 on Android, while “wine” ranks 170 on iPhone and a distant 514 on Android. However, both “wine bars” and “beer and wine” rank higher on Android than on iPhone (“wine bars” ranks 113 on Android vs. 152 on iPhone; “beer and wine” ranks 115 on Android vs. 196 on iPhone). The most searched dish on both platforms is “pizza” (ranked 5 on iPhone vs. 6 on Android), and Yelpers also seem to love “sushi” (ranked 6 on iPhone vs. 7 on Android), “pho” (ranked 20 on iPhone vs. 23 on Android), and “seafood” (ranked 24 on iPhone vs. 20 on Android).
However, there are some obvious differences between both platforms. Android users seem to look for deals a lot more than iPhone users (“deals” is ranked 24 on Android and 221 on iPhone). In general, the word “cheap” is more often used on Android searches than iPhone ones: “cheap eats” (ranked 398 on Android vs. 639 on iPhone), “cheap dinner” (ranked 446 on Android vs. 846 on iPhone), “cheap motel” (ranked 1,172 on Android vs. 1,296 on iPhone), and just “cheap” (ranked 1,367 on Android vs. 2,272 on iPhone). Conversely, iPhone users might be more attracted to “luxury”: “luxury nail salon” (ranked 4,240 on iPhone vs. 7,863 on Android), “luxury hotel” (ranked 25,719 on iPhone vs. 37,570 on Android), or just “luxury” (ranked 24,090 on iPhone vs. 43,484 on Android). The same goes for “luxe” (ranked 8,045 on iPhone vs. 10,358 on Android).
Android Yelpers seem more interested in “nightlife” (ranked 11 on Android vs. 52 on iPhone), especially “dance clubs” (96 vs 156). On the other hand, iPhone users have a soft spot for brunch (rank 14 vs 26) and Starbucks (15 vs 30). As far as coffee chains go, they are also more interested in Peet’s Coffee (649 vs 1676). After the staple foods that are pizzas, sushi, and pho, iPhone Yelpers have a taste for ramen noodles (22 vs 28) while Android Yelpers favor steaks (25 vs 28). When dessert is considered, iPhone users enjoy ice cream (ranked 31) more so than Android ones (ranked 50). iPhone Yelpers are also looking for Whole Foods grocery stores more often than Android ones (159 vs 660 for “whole foods market”, and 166 vs 421 for “whole foods”): this is perhaps not surprising as they also search for organic food more often (621 vs 911).
Finally, Android users are Yelping more for “hotels” (ranked 59) than iPhone users are (ranked 80), and the same is true for “hair” (ranked 21 on Android vs. 29 on iPhone).
Acknowledgements
Thanks to Travis Brooks and Alexa Herasimchuk
Become a Data Scientist at Yelp
Looking at the differences between iPhone vs. Android users is only scratching the surface. If you're interested in digging into more of our data, apply to become a Data Scientist at Yelp.
View Job