ElastAlert: Alerting At Scale With Elasticsearch, Part 1

-
Quentin L., Software Engineer
- Oct 6, 2015
Elasticsearch at Yelp
Yelp’s web servers log data from the millions of sessions that our users initiate with Yelp every day. Our engineering teams can learn a lot from this data and use it to help monitor many critical systems. If you know what you’re looking for, archiving log files and retrieving them manually might be sufficient, but this process is tedious. As your infrastructure scales, so does the volume of log files, and the need for a log management system becomes apparent. Having already used it very successfully for other purposes, we decided to use Elasticsearch for indexing our logs for fast retrieval, powerful search tools and great visualizations.
For those unfamiliar, Elasticsearch is an open source project that acts as a database and search engine for JSON documents. Along with Logstash and Kibana, it forms the ELK stack. Logstash is a document ingestion and transformation pipeline and Kibana is a visual front end service. With ELK, we are able to parse and ingest logs, store them, create dashboards for them, and perform full text search on them.

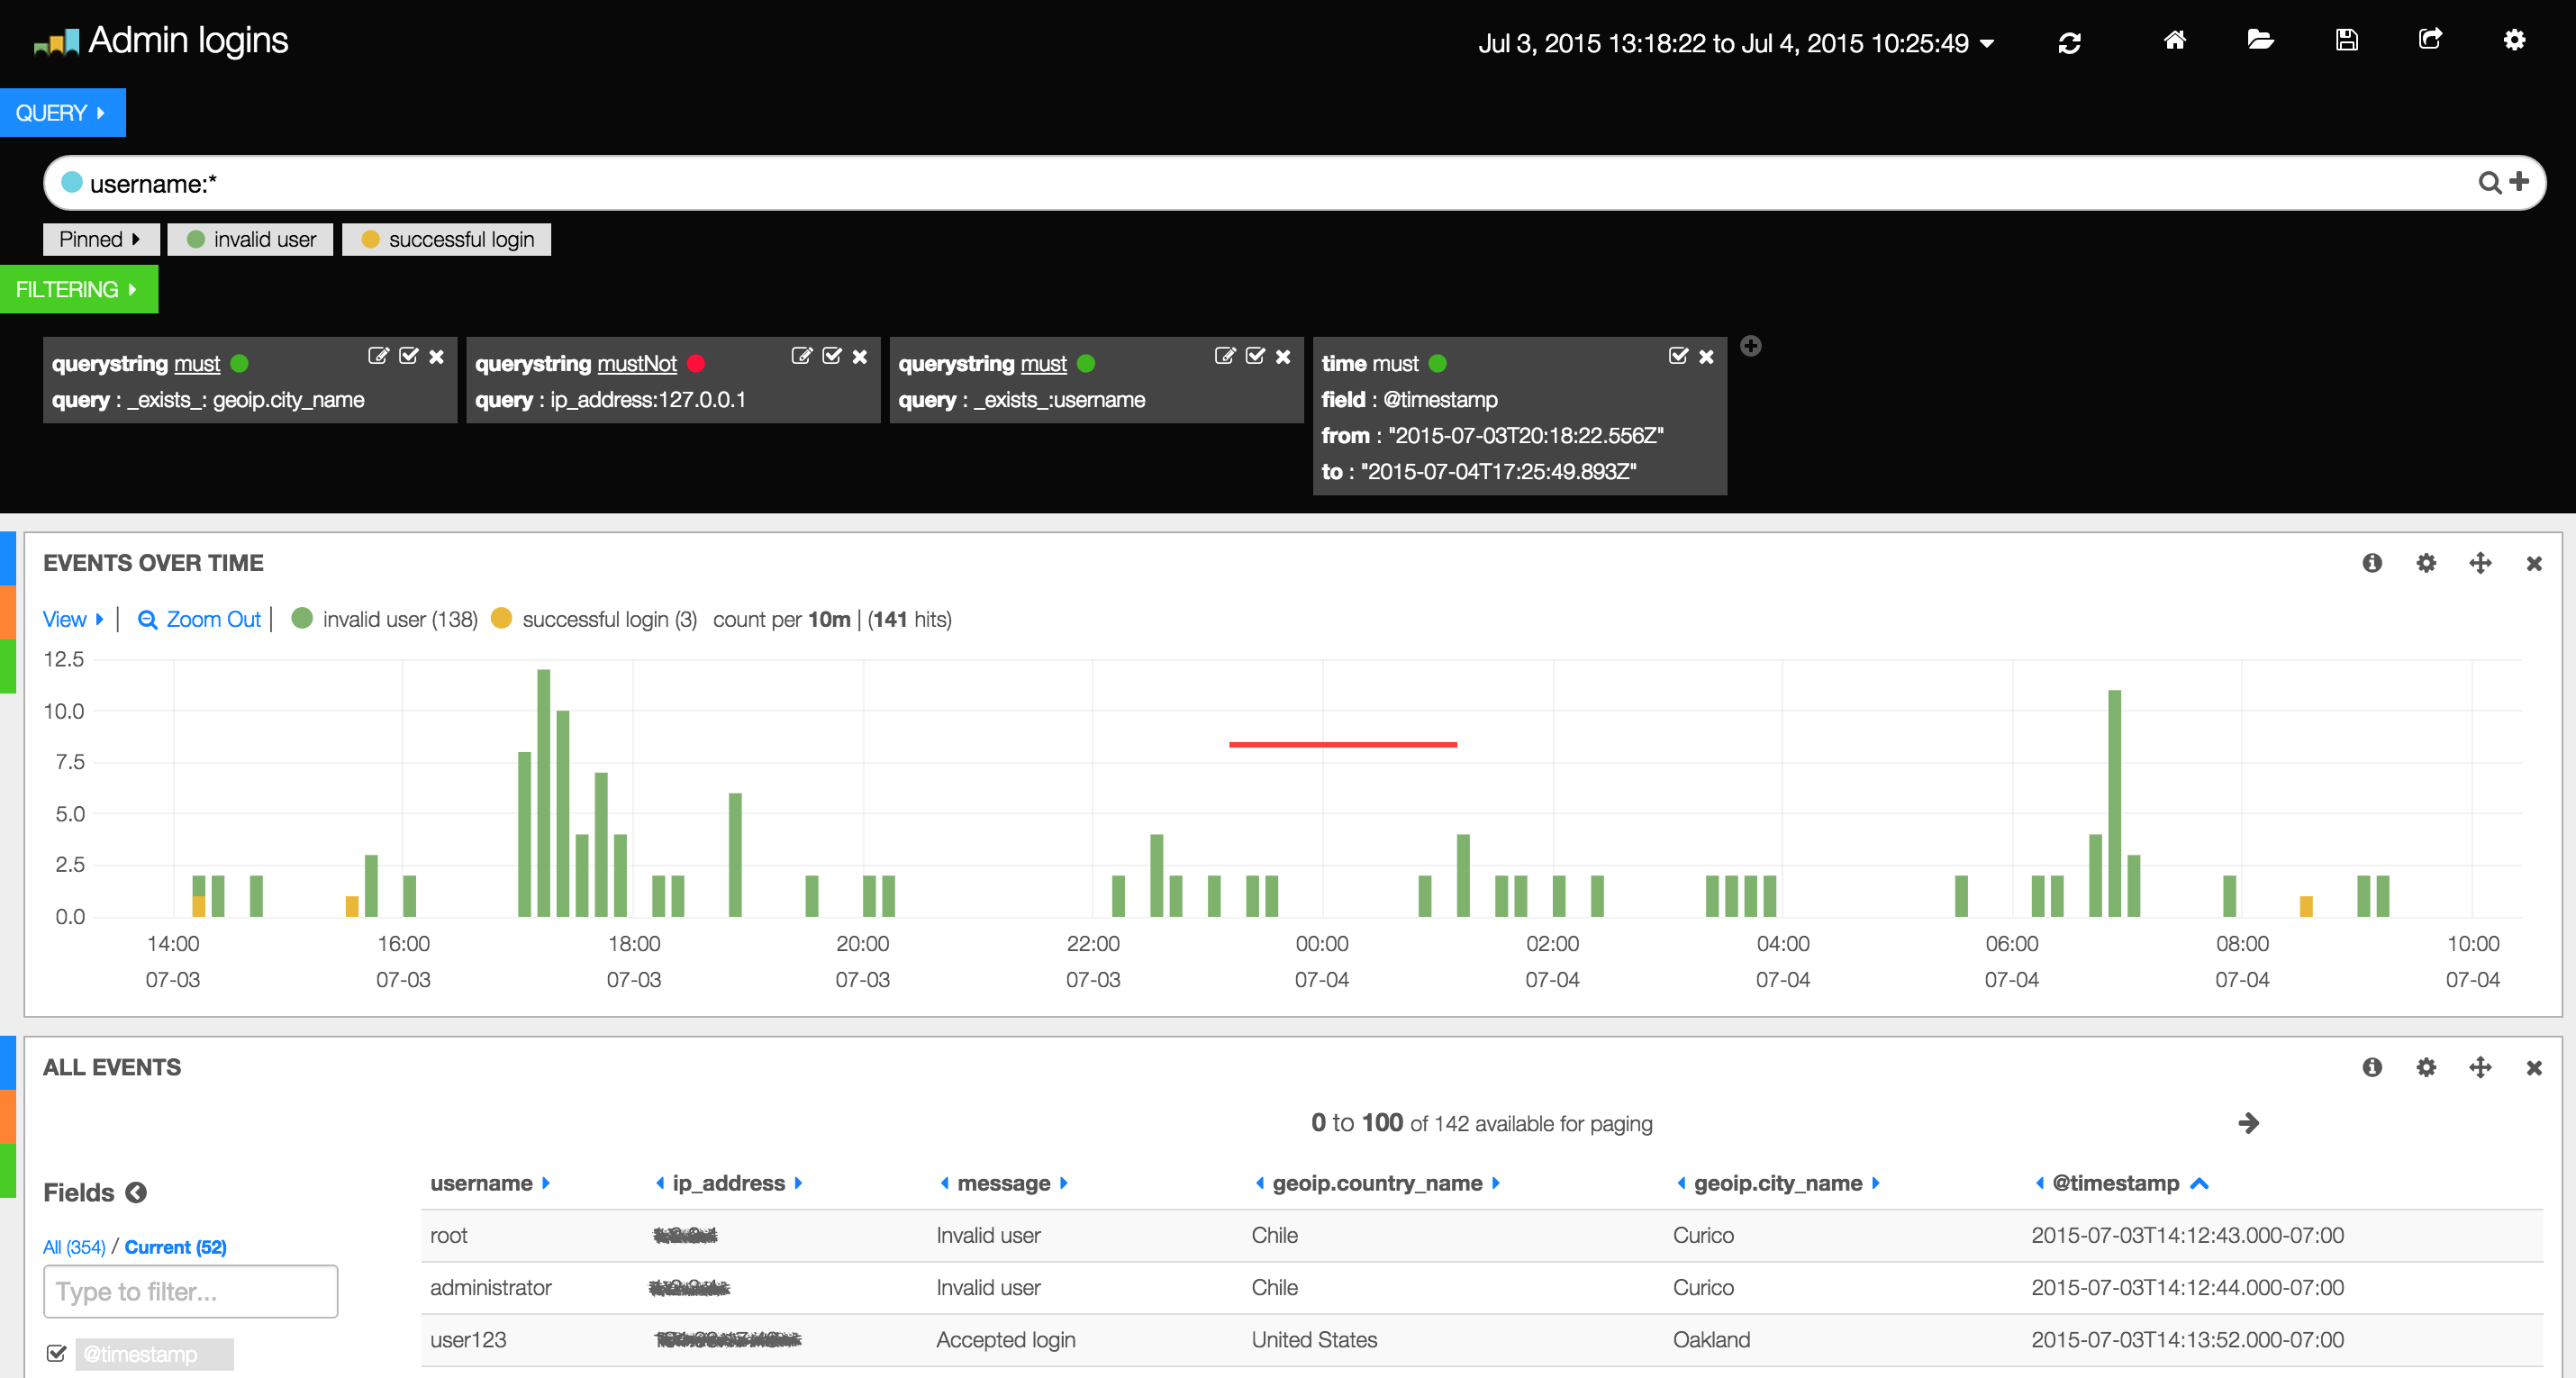
An example Kibana dashboard.
ELK scales well and has helped with incident response, comparing metrics, tracking bugs, etc. However, as the number of dashboards and amount of data grew, we realized the need for automation. Unless someone was actively looking at a dashboard or searching for the right thing, we missed a lot.
How can we get alerted if this happens?

We needed a way to monitor the data we had in Elasticsearch in near real time. We looked at several other projects, but they weren’t quite what we needed. We wanted a generic way to look for certain patterns in our data, without duplicating our data somewhere or spinning up a heavyweight service. We needed this to be accessible to engineers from every team across the organization to use with their own logs.
Enter ElastAlert
ElastAlert was developed to automatically query and analyze the log data in our Elasticsearch clusters and generate alerts based on easy-to-write rules. Our initial goal was to create a comprehensive log management system for our data. We had a few basic alerts we wanted, such as “Send us an email if a user fails login X times in a day” or “Send a Sensu alert if the number of error messages spikes.” This led us to a general architecture which could suit almost any scenario we needed across the company, not just on the security team. ElastAlert takes a set of “rules”, each of which has a pattern that matches data and a specific alert action it will take when triggered. For each rule, ElastAlert will query Elasticsearch periodically to grab relevant data in near real time.
We designed ElastAlert with a few principles in mind
- It should be easy to understand and human readable. For this, we chose a YAML format with intuitive option names.
- It should be resilient to outages. It records every query it makes, and can pick up exactly where it left off when it turns back on.
- We designed it to be modular. The major components, rule types, enhancements and alerts, can all be imported or customized by implementing a base class.
ElastAlert Rules
Lets look at an example ElastAlert rule and break it down into its three major components.
name: Large Number of 500 Responses
es_host: elasticsearch.example.com
es_port: 9200
index: logstash-responses-*
filter:
  - term:
      response_code: 500
type: frequency
num_events: 100
timeframe:
  hours: 1
alert:
  - email
email: example@example.com
1. Define which documents to monitor
es_host: elasticsearch.example.com
es_port: 9200
index: logstash-responses-*
filter:
  - term:
      response_code: 500
In the first component, we are defining documents that this particular rule will be monitoring. A host, port, index and optional set of filters let you narrow down the rule to a specific set of documents. The filters are written in the Elasticsearch query DSL, which gives you powerful search tools like regular expression matching, range, and analyzed strings. The filters can even be copied directly from your Kibana dashboard without having to manually type them.

filter:
  - regexp:
       ip_address: “10\\..*”
  - term:
       _type: ssh_login
  - term:
       outcome: failure
You can also set different options for how ElastAlert queries Elasticsearch. You can control how often the queries are run, how big each query window is, whether to use the search or count API, and whether to run the query delayed from real time. There is also basic support for doing terms aggregations.
2. Which patterns to look for
Each rule has a type, which is the type of pattern that the data will be checked against. In this example, we are matching “100 events in one hour”. This type of pattern is looking at the frequency of events occurring, so it’s called frequency.
type: frequency
num_events: 100
timeframe:
  hours: 1
Each type also has a few required parameters. For frequency, we care about how many events must occur within a specific timeframe for an alert to fire. Almost all of the rule types use rolling windows, with an associated timeframe, to store and process data.
There are several other rule types available in ElastAlert.
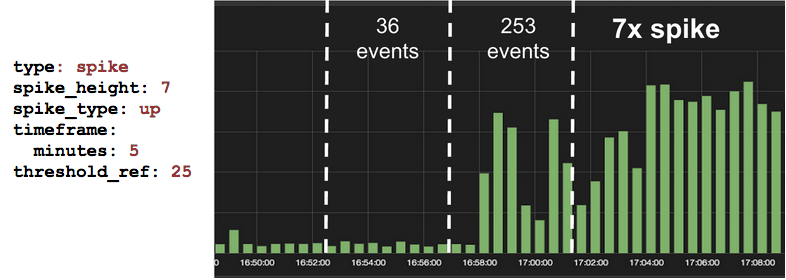
Spike
The spike rule uses two sliding windows to compare the relative number of events. It matches when the current window has more or less than X times as many documents as the reference window.

In this example, the current window contains 7 times as many documents as the reference window, and the reference window has at least 25 events.
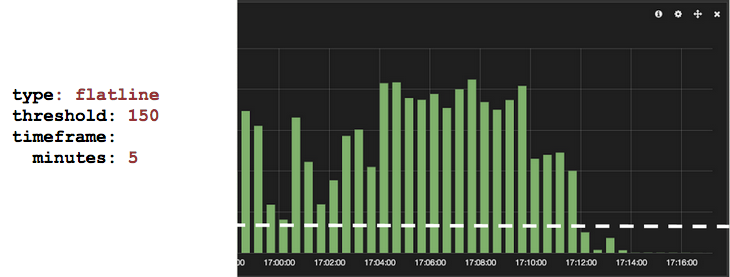
Flatline
The flatline rule matches when the number of documents in a sliding window falls below a threshold.

New Term
The new term rule matches when there is a never-before-seen value for a field. This is useful for auditing new items while ignoring commonly occuring values.

If only all malware was this aptly named.
Change
The change rule matches when a field has changed, within a time limit, grouped by another field.

In this example, the country field for user1 has changed from from United States to Romania.
Additional custom rule types can either be imported or created by implementing a simple base class.
3. How to alert
There are several types of included alerters. Of course, as in the example, you can send emails. You can also open JIRA issues, run arbitrary commands, and custom python code. Each alerter has it’s own specific options, but there are several that can apply to any type, such as realert, which is the minimum time before sending a subsequent alert for a given rule, and aggregation, which allows you to aggregate all alerts which occur within a timeframe for a rule together.
When a rule is triggered, it outputs a dictionary as the match. For some types of rules which match on a single document, this dictionary is just the document from Elasticsearch which triggered the alert. For types which alert on a large number of documents, the match can include additional information, such as aggregate counts for different fields. For most alerts, this dictionary is then converted into a string in one of several ways, and that string is the body of the alert. You can also set the text yourself:
alert_text: |
    ElastAlert has detected suspicious activity for {0}.
    At {1}, an {2} error occured. Do something about it!
alert_text_args:
  - username
  - timestamp
  - error_type
With this option, we can use templated text, optionally populated with fields from the match, as the alert text. There is another option to add a link back to Kibana, which has the filters prepopulated from the rule, and the time settings set to the time of the alert.
Assuming there exists a field called url, and by adding an option, top_count_keys, to our original example rule, we might get an alert that looks something like this:
Large Number of 500 Responses

At least 100 events occurred between 8-18 4:20 PDT and 8-18 5:20 PDT

url:
/some/url/path: 73
/foo/bar: 14
/index.html: 13

@timestamp: 2015-08-18T12:20:36Z
There is also another layer, between matches and alerts, called enhancements. Here, custom code can be run to transform, perform additional processing on, or drop the matches before they alert.
Look out for part 2 of this blog post, with more practical examples and information about how we make use of ElastAlert as part of our Security Incident and Event Management infrastructure!
For a full list of features, as well as a tutorial for getting started, check out the documentation. Source can be found on Github. Pull requests and bug reports are always welcome! If you have any questions, jump into our Gitter channel.
Securing The Yelps
If you're interested in building tools like ElastAlert that help us secure Yelp and its users, apply to become a Software Security Engineer
View Job