Fullerite: A New Mineral To Collect Metrics

-
Ryan N., Software Engineer
- Oct 26, 2015
Collecting System Metrics at Scale
Monitoring system metrics (e.g. CPU utilization, loadavg, memory) is not a new problem. It’s been necessary for a long time and there are a few that already exist, most notably diamond and collectd. At Yelp, we run thousands of different machines hosted all over the world. The simple volume of metrics we monitor quickly starts to complicate how we collect them. After trying out a few different solutions (and breaking many things) we decided to write our own: fullerite.
A History of System Metrics Collection
We started using diamond to report our system metrics. Everything seemed to be running great so we started to add more collectors. First we had a few smaller collectors, causing little bumps in the total volume of metrics. Finally, we added our service layer metrics, which roughly doubled the total volume. Things seemed fine; charts were populating and the system was humming along. Shortly thereafter we noticed that some machines were running out of memory. After some digging we saw that diamond was eating all the memory on the boxes. It was consuming upwards of 14GB! We started to put in solutions to help mitigate this problem, but we knew that they were mostly stop gap solutions.
Over the course of the next month we had a few high severity tickets, so we put in more safety checks and continued to investigate and test diamond. We discovered that the concurrency model that diamond employs (one handler process and a process per collector) was too sensitive to latency. A single handler could block the other handlers, causing diamond’s internal queues of metrics to back up. This would result in a not-so-gradual rise in diamond’s handler process’s memory. With a hackathon coming up, a few developers got together and said “We could write a replacement in 2 days!”
Our goals with building fullerite were:
- Have a predictable and low memory footprint
- Provide a lot of isolation and concurrency in the tool
- Support dimensional metrics
- Have an easy build and deploy system
Introducing Fullerite
A few weeks later, once we’d gotten most of the kinks out, we released our replacement: fullerite. Fullerite follows a similar pattern as both diamond and collectd; it has a configurable set of collectors that multicast to a set of handlers.
Interesting features include:
- Fully compatible with diamond collectors
- Written in Go for easy reliable concurrency
- Configurable set of handlers and collectors
- Native support for dimensionalized metrics
- Internal metrics to track handler performance

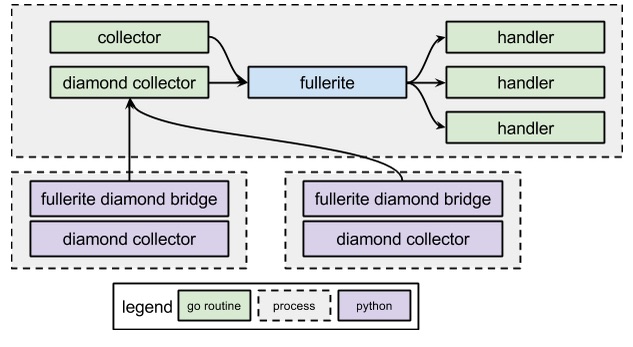
The concurrency model in fullerite is important, we strove to isolate and decouple the components as much as possible. Because it is mostly written in Go, almost everything that can, is running in its own goroutine. This allows us to isolate the different handlers and collectors; latency in a single component won’t affect the other components. The fullerite and fullerite diamond bridge are running as their own linux services (using upstart). Fullerite spawns go routines for each configured handler and collector and then collectors report their metrics into separate channels. Fullerite passes through the metrics to each handler so that it can, in its own time, process that metric. The handlers often spawn further goroutines to deal with the batching or actual HTTP sending.
The fullerite diamond bridge service starts each of the configured collectors. Each Python collector has its own embedded connector to the fullerite bridge to continue the paradigm of isolation. These collectors independently report their metrics back to the main diamond collector (over TCP) running in fullerite which propagates them just like any other collector.
Where We Are
Here is some info around what the current state of fullerite is at Yelp:
- Deployed to thousands of machines
- Running in both AWS and local data centers all over the world
- Running 10-12 collectors per instance
- Generating upwards of 3-4,000 metrics per minute per instance
- Generating over 10M metrics per minute across the whole cluster
- Consuming on average 10 MB of memory, with peaks up to 40 MB (relative to the GBs of memory diamond was using)
These metrics make us happy with our little project. It has been extremely stable both in its performance and consistency. That is to say, based on the role of the box (e.g. service_machine, web, database) we can predict how much CPU, memory, and load fullerite will utilize.
We have some great ideas for future work, most notably:
- expose the multidimensional interface better to diamond style collectors
- make the golang collectors and handlers pluggable
- improve performance (e.g. CPU utilization, memory footprint)
This project grew out of a few days of a few engineers thinking we could do better. It has been a real blast to take this little idea and see it grow into an integral part of our performance and monitoring infrastructure. Go check it out on github!
Build the Infrastructure that Powers Yelp
If finding new ways to build and manage servers and services all over the world excites you, join our team!
View Job