SignalForm: Charts as Code with SignalFx and Terraform

-
Antonio Verardi, Yashashree Kokje, Software Engineers
- Oct 6, 2017
Monitoring the health of our systems is a critical part of maintaining Yelp’s infrastructure. We collect millions of data points that help us observe the performance and status of our services. This data powers visualization and monitoring systems so that we can alert on anomalies and derive actionable insights, especially during on-call procedures.
SignalFx is our preferred vendor for metrics visualization and monitoring. They provide a rich UI with many robust analytics capabilities. At Yelp’s scale, we use SignalFx to create hundreds of detectors, charts and dashboards. Managing and finding these resources quickly is a challenge. Our engineering teams need to be able to discover the graphs and detectors they own, quickly create and update them and be informed about changes to them.
In an effort to programmatically improve how we manage dashboards, we developed SignalForm, a tool to codify SignalFx resources and version control them.
At Yelp we believe in “infrastructure as code”. We extensively use Terraform to programmatically build, change, and version infrastructure safely and efficiently. Terraform manages most of our AWS infrastructure, allowing engineers to code review infrastructure changes before they’re applied.
We decided to apply the same methodology to our SignalFx artifacts. SignalForm is a Terraform provider which leverages the new SignalFx API to create, update and delete SignalFx resources. We now keep all critical SignalFx artifacts versioned in git and engineers are able to programmatically manage them. Artifacts are namespaced under each team and project to enable quick discovery. With the ability to review the SignalFlow code powering a detector, teams have started to collectively devise and validate the alerting logic before anyone gets paged by an inefficiently configured detector.
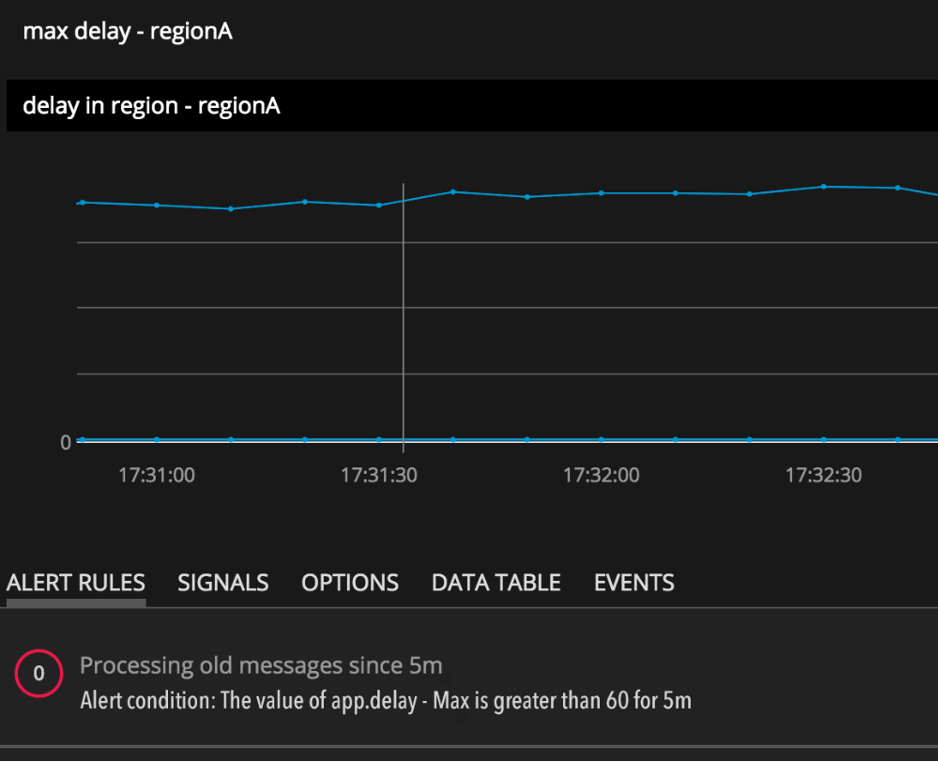
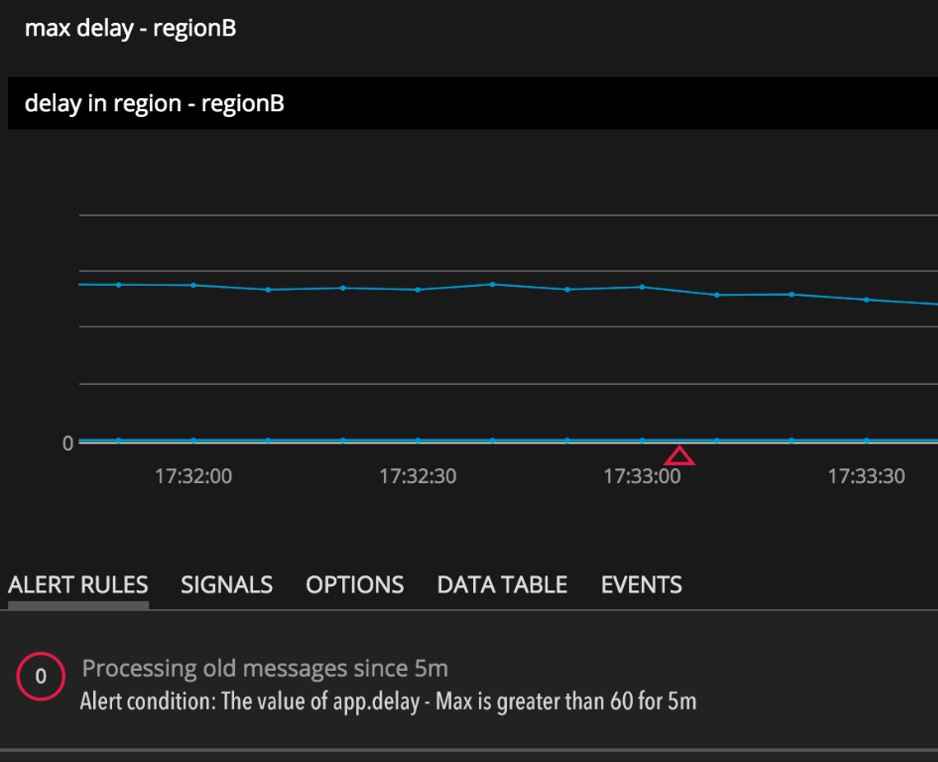
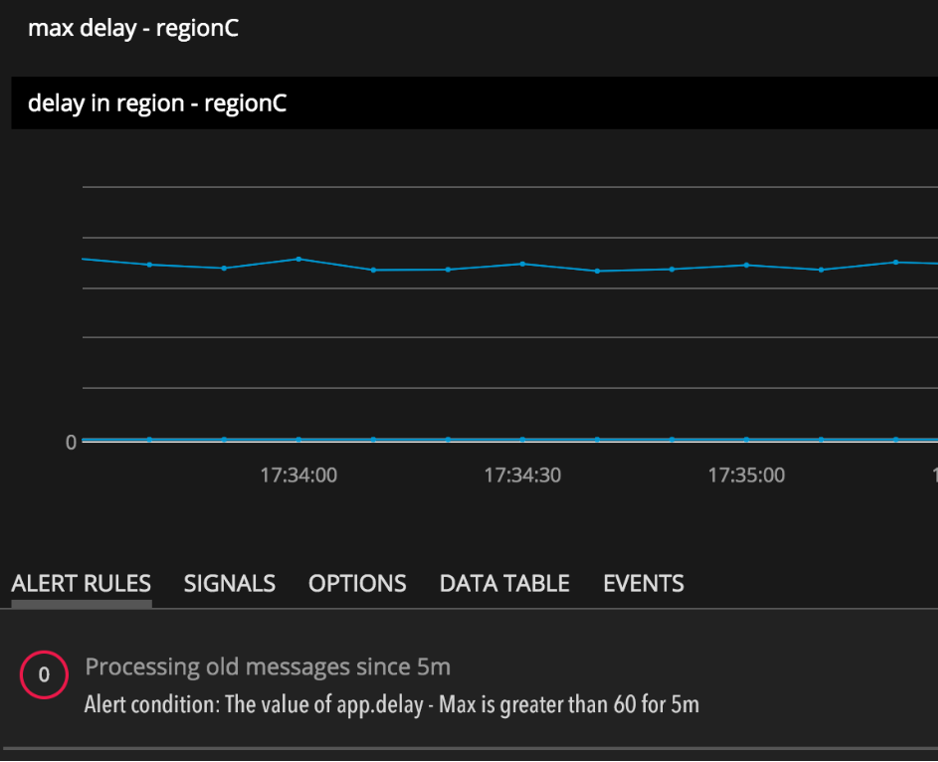
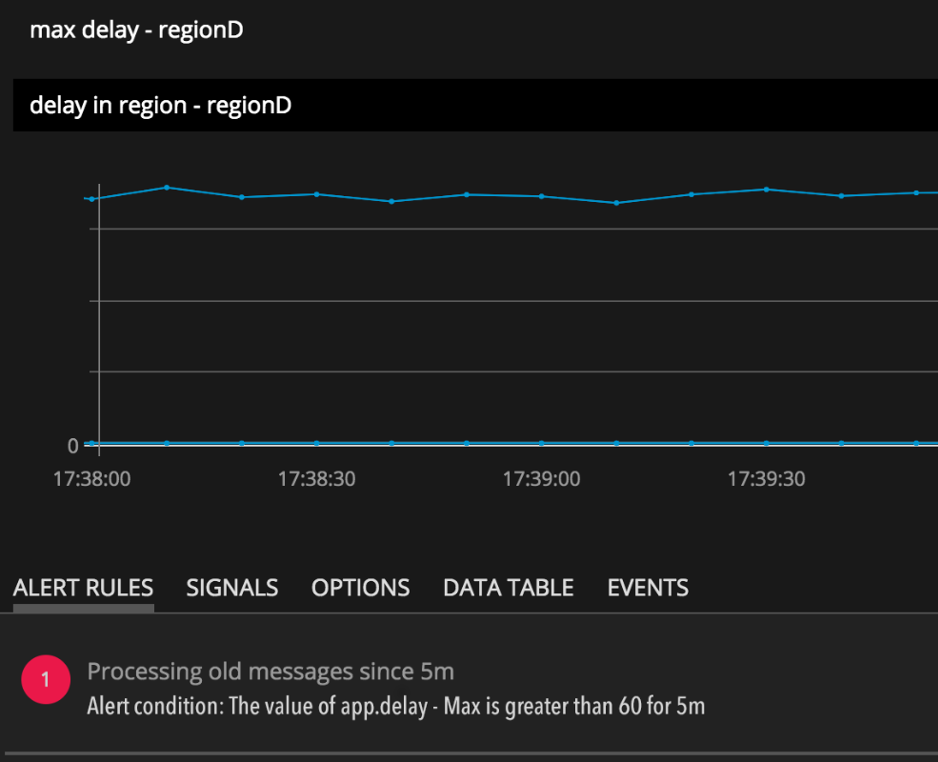
What would creating detectors as code look like? The snippet below creates a detector monitoring the maximum delay seen by our application for every region it’s been deployed to. Terraform’s interpolation syntax allows us to create one detector resource for each value declared in the list of regions. This list can be shared across multiple files and folders to create additional resources.
variable "regions" {
    default = ["regionA", "regionB", "regionC", "regionD"]
}

resource "signalform_detector" "application_delay" {
    count = "${length(var.regions)}"
    name = "max delay - ${var.regions[count.index]}"
    description = "delay in region - ${var.regions[count.index]}"
    program_text = <<-EOF
        filters = filter("region","${var.regions[count.index]}")
        signal = data("app.delay", filter=filters).max()
        detect("Processing old messages 5m", when(signal > 60, "5m"))
    EOF
    rule {
        description = "Max delay > 60s for 5m"
        severity = "Critical"
        detect_label = "Processing old messages since 5m"
        notifications = ["Email,foo-alerts@bar.com"]
    }
}  |
 |
 |
 |
Similarly, you can create a chart with SignalForm to visualize a metric:
resource "signalform_dashboard" "queue_length_dashboard" {
    name = "Queue Length Dashboard"
    time_range = "-1h"
    variable {
        property = "region"
        alias = "region"
        values = ["regionA"]
        values_suggested = "${var.regions}"
        value_required = true
        restricted_suggestions = true
    }
    chart {
        chart_id = "${signalform_list_chart.queue_length.id}"
        width = 6
        row = 1
    }
}

resource "signalform_list_chart" "queue_length" {
    name = "queue length"
    program_text = <<-EOF
        filters = filter("device", "dm-0")
        data("iostat.queue_length", filter=filters).mean().publish()
    EOF
    color_by = "Dimension"
    refresh_interval = 60
    sort_by = "-value"
}
To provide validation and easier introspection of all SignalFx artifacts created through Terraform, we built a set of developers tools. Additionally, these tools allow us to test whether a detector would have fired by replaying data from the past using SignalFx preflight.
SignalForm has ended up being more than just another Terraform provider for us. It has enabled us to improve Yelp’s monitoring culture. Today we are able to evolve our charts, dashboards and detectors together with the rest of our infrastructure.
All the code for SignalForm and the developers tools is available on GitHub. Get the latest release to start using it or clone the repo and start contributing!