Performance Improvements for Search on The Yelp Android App - Part 3

-
Tyler Argo, Software Engineer
- Jun 21, 2018
In our previous blog post, we made changes to the app that improved the initial rendering performance and scroll performance of the search results in the Yelp android app. In this blog post, we’ll cover how we monitor the performance of these changes and future changes to the app to ensure no performance regressions occur and undo all of our hard work!
Step 3: Monitoring Performance Improvements
Making changes that improve performance is great, but there’s no point in making these improvements if future changes by engineers could undo all the hard work you’ve done to get to this point. That’s why it’s important to monitor your application’s performance and be able to identify performance regressions.
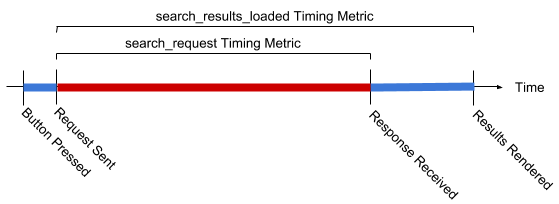
A big part of our search performance monitoring involves tracking the search_request and search_results_loaded timing metrics mentioned in part 1 of this series. We collect these metrics and analyze them through Splunk not only to measure the baseline performance of our search results, but also to monitor them in case of a regression. If the search_results_loaded timing changes by 5% between app releases, an alert is sent via email to notify us of the change. Over the course of this project, we received two such alerts to notify us of performance changes, but luckily for us they were performance improvements rather than performance degradations.
Another, more experimental angle that we’ve taken to monitor performance is to introduce automated performance tests that use the FrameMetrics API. At Yelp, we run our Android instrumentation tests using espresso and distribute the test runs across multiple virtual devices using Firebase test lab. As part of our continuous integration process, we run these integration tests before merging any feature branches into master. If the tests don’t pass, then the branch is not merged.
To monitor application performance, we’ve introduced performance instrumentation tests that run alongside our integration tests. These performance tests are different from our integration tests in a few important ways:
- There is no success case, so if the test fails it does not block the continuous integration process
- We enable animations in the tests to get an accurate performance profile
- This means tests take longer to run and are more prone to flaking through espresso actions
- We run these tests on physical devices instead of emulators to be as close to the end user experience as possible
In these performance tests, we analyze the performance of the device in rendering each and every frame. To accomplish this, we took advantage of the new FrameMetrics API to log frame stats during the execution of an instrumentation test. The API gives us a whole bunch of information about each frame that is rendered on the device.
The most important piece of information that we record is the duration that it takes for each frame to render. If this duration is less than 16ms we consider it a “fast frame”. If it’s slower than 16ms, then we consider it a “dropped frame”, meaning that the display didn’t update when it was time to refresh, so the frame was “dropped”. For dropped frames we also record additional information to see if we can pinpoint the reason why the frame was dropped.
Here’s an example of the output from one of the performance tests:
[
  {
    "SearchListPerfTest.test_ScrollToBottom_ToCapturePerformanceProfile": {
      "droppedFrameAverageTotalDuration": 69.27096400000002,
      "droppedFrameMetrics": [
        {
          "ANIMATION_DURATION": 868385,
          "COMMAND_ISSUE_DURATION": 91301468,
          "DRAW_DURATION": 29282346,
          "FIRST_DRAW_FRAME": 0,
          "INPUT_HANDLING_DURATION": 59271,
          "INTENDED_VSYNC_TIMESTAMP": 1432112745057,
          "LAYOUT_MEASURE_DURATION": 30366514,
          "SWAP_BUFFERS_DURATION": 6132188,
          "SYNC_DURATION": 5824896,
          "TOTAL_DURATION": 619208032,
          "UNKNOWN_DELAY_DURATION": 455240776,
          "VSYNC_TIMESTAMP": 1432562745039
        },
        ...
      ],
      "fastFrameAverageTotalDuration": 12.279790835820895,
      "numDroppedFrames": 35,
      "numTotalFrames": 102
    }
  }
]
We write this output to a json file that is saved as an artifact of the test on google cloud storage. From there, our Jenkins continuous integration job collects all of the output files from these tests and aggregates the data into events that are then ingested by Splunk. That lets us create alerts for when performance degrades significantly.
Step 4: Repeat
Just like a software product, performance work is never really “done”. It is an iterative process that involves building on previous work and avoiding regressions. We were able to make significant improvements to our search result load times on Android purely through changes on the client. These improvements were made over a series of changes that built on each other. At some point you will see that there is a diminishing return on your investment of effort. If it takes a week to reduce your timings by only a few milliseconds, then it might be a good time to stop and re-evaluate where your efforts are best spent.
Next Steps for Performance Monitoring
We’ve considered using the FrameMetrics API to monitor aggregate dropped frames in production. While this would give us a great view into real-world client side performance, we still haven’t investigated to see what the performance overhead would be.
Conclusion
Over the past three blog posts, we’ve outlined how we have established a system of reliable measurement through our metrics collection, improved performance by offloading work off of the main thread, asynchronously inflating views and taking advantage of caching a view model for each search result. We’ve also introduced a monitoring framework and alerts to help avoid regressions and have identified potential improvements that warrant further investigation. Onwards to a faster Yelp Android app!
Want to build next-generation Android application infrastructure?
We're hiring! Become an Android developer at Yelp
View Job