Implementing multi-metric scaling: making changes to legacy code safely

-
David R. Morrison (Contractor); Charan Gangaraju (Software Engineer)
- Aug 7, 2024
We’re excited to announce that multi-metric horizontal autoscaling is available for all services at Yelp. This allows us to scale services using multiple metrics, such as the number of in-flight requests and CPU utilization, rather than relying on a single metric. We expect this to provide us with better resilience and faster recovery during outages.
This year, PaaSTA (Yelp’s platform-as-a-service, which we use to manage all of the applications running on our infrastructure) turns eleven years old! The first commit was on August 20th, 2013, and the first public commit was on October 22nd, 2015. That’s over half of Yelp’s lifetime! It’s quite remarkable that this tool has lasted for so long without being replaced by something else. We think it’s longevity really speaks to the vision and skill of the original PaaSTA authors. Of course, PaaSTA has changed a lot since then, and in this post we discuss how we were able to make a potentially risky change to a bit of legacy PaaSTA code without causing any downtime (our approach in this project was heavily inspired by Philippe Gaultier’s post on making changes to legacy codebases, though PaaSTA is in a lot better shape than what he described).
Horizontal Pod Autoscaling
The feature that we wanted to implement is called “multi-metric scaling.” PaaSTA serves as a platform on top of Kubernetes, and as such, it uses the Kubernetes Horizontal Pod Autoscaler (HPA) to scale applications running on the platform in response to load. In essence, the HPA watches a variety of metrics such as CPU utilization, worker thread count, and others, and uses those input metrics to determine the number of pods (or replicas) that an application should run at any point in time.

A screenshot from Jira showing the ticket for supporting multiple metrics in PaaSTA was created on 2021-01-07.
But here we are in 2024, and PaaSTA still doesn’t support multi-metric scaling, despite having it on its roadmap since at least 2021! Why not?
The technical change here wasn’t hard. Internally, PaaSTA already represented the HPA metrics source as an array–an array containing only a single element. “All’’ we needed to do was expose this functionality to our developers. The challenge here was twofold. Firstly, depending on the implementation, this could result in a non-backwards-compatible API change. Secondly, changes to autoscaling are always scary because they have the potential to cause outsize impact on the systems relying on them. So how did we manage it?
The pre-work: settling on an API and getting buy-in
In the first two weeks of the project, we didn’t write a line of code. We had a lot of experience with PaaSTA in the past, but our knowledge was several years out of date, so we spent most of our time reading code, asking questions, writing docs, and getting buy-in for the work. It was clear early on that the biggest concern people had was how this work would impact on-call load, particularly since we wouldn’t be on-call for the resulting changes. Having seen first-hand the damage bad autoscaling changes can cause, we weren’t about to argue with this! Additionally, we needed to ensure that several systems interacting with our autoscaling services could handle these changes. For example, Yelp has a system which we call Autotune that automatically rightsizes resource allocations for our workloads, and this system has special-cased behavior for the various types of service autoscaling that we support.
The plan we proposed had several steps. Since this was a legacy part of the PaaSTA codebase, the first change we wanted
to make was to clean up some of the deprecated or old features. We hoped that doing so would make the codebase easier to
work with and rebuild our familiarity with making changes to this code. Next, we suggested adding increased validation
via the paasta validate command. This command is intended to verify that the configs in the services’ soaconfigs
directory are correct, but the validation around the autoscaling configuration was fairly lax. By providing much
stricter validation, we would be able to ensure that application owners couldn’t accidentally make incorrect changes to
their service configuration, thereby improving safety and reliability overall. Lastly, we suggested that we spend time
improving our dashboards and alerts around the HPA, to help us understand what “baseline” behavior was before making any
changes.
The actual API change we agreed upon was straightforward. We would change this code:
autoscaling:
  metrics_provider: cpu
  setpoint: 0.8
to this:
autoscaling:
  metrics_providers:
    - type: cpu
      setpoint: 0.8
Since we control both PaaSTA and the soaconfigs directory, we can make a non-backwards-compatible change like this more easily. The procedure we proposed was to have PaaSTA temporarily support both the old and new autoscaling formats, then migrate everything in soaconfigs to the new format, and then remove support from PaaSTA for the old format. Once all of these changes were made, we were finally in a position to start adding multi-metric support to the handful of applications that needed it.
Snapshot testing for fun and profit
You might have noticed that 90% of the work we wanted to do was just to change the API. The underlying metrics sources wouldn’t change for any PaaSTA service until the very last step! Which means that, even though the code was old and potentially hard to reason with, we could use snapshot testing to ensure that behaviors didn’t change. (Snapshot testing is the process of recording the output-or a snapshot-of a program, and then comparing future output from that program to the snapshot.) So that’s what we did.
PaaSTA uses the Prometheus Adapter to collect metrics from Prometheus (our timeseries metrics datastore) and forward them to the HPA. The Prometheus Adapter takes as input a large list of PromQL queries that configure the metric values seen by the HPA. So, in the first phase of the project, we figured out how to generate the Prometheus adapter config locally. Ultimately if the Prometheus Adapter config didn’t change, then the HPA behavior wouldn’t change! We could simply compare the before-and-after output of this config file for each change that we wanted to make to ensure that the overall system would stay stable.
We also set up some dashboards using Grafana to monitor the HPA. Since we knew that we would eventually have different services using different combinations of metrics sources, we used Grafana’s “Panel Repeat” feature to be able to automatically detect which metric sources a particular application was using, and only show the relevant metrics for those metrics. Even though nothing was using multiple metrics yet, we wanted to have the dashboards in place for when we started.
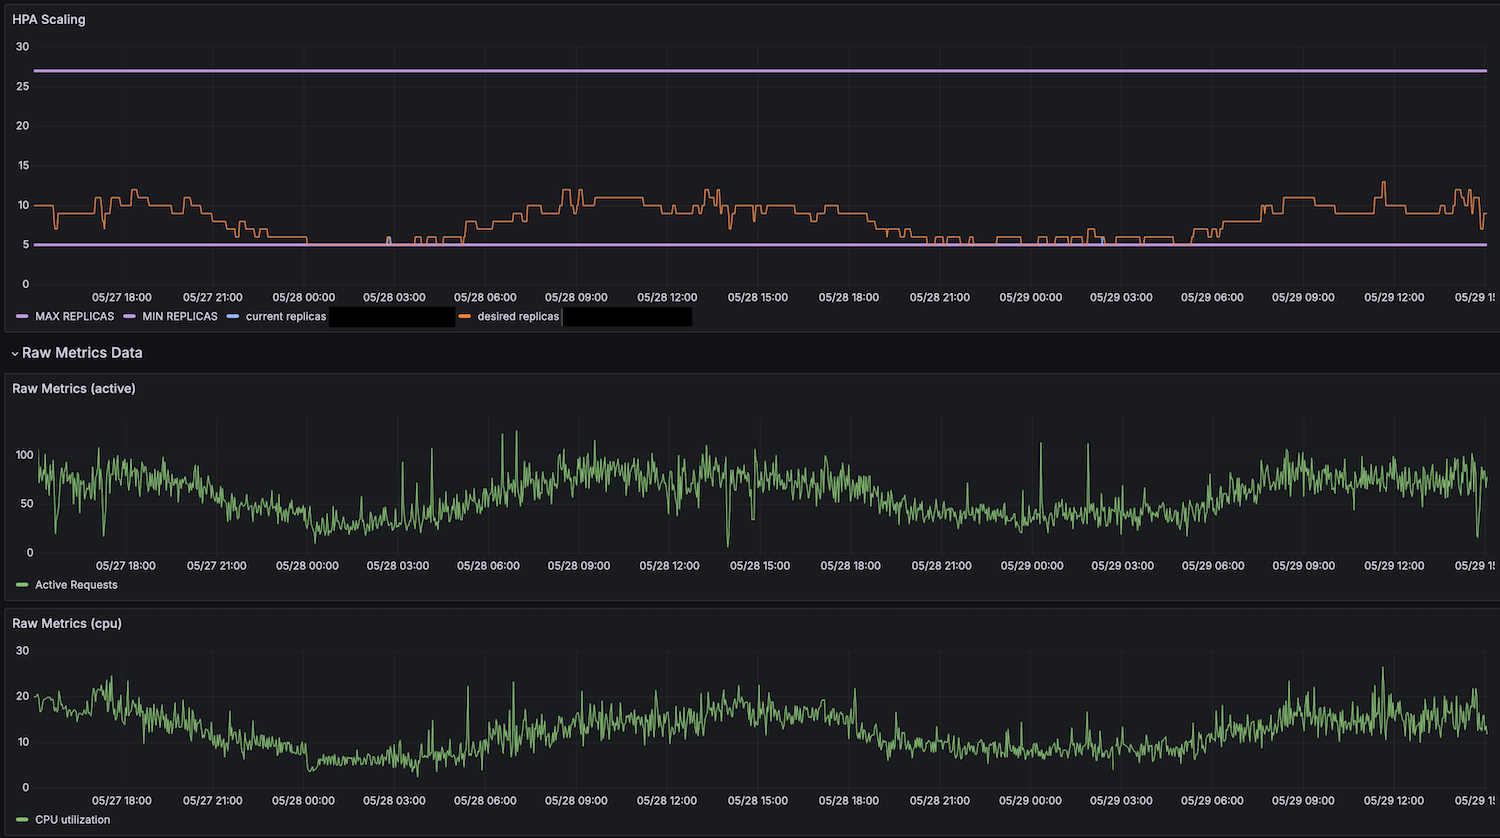
A screenshot of a Grafana dashboard showing multiple input metric sources for a single application.
Once all that was in place, we were ready to make the actual changes. Because we were constantly testing against “what was in prod,” we didn’t want to use a static snapshot that might give us an incorrect output or test against old versions of soaconfigs. Instead, for each change, we followed this process: we checked out the “main” branch, generated a snapshot, checked out our feature branch, generated another snapshot, and finally compared the two.
The command that we used to generate our snapshots looked like this:
paasta list-clusters | xargs -I{} bash -c "python -m paasta_tools.setup_prometheus_adapter_config -d \
    ~/src/yelpsoa-configs -c {} --dry-run &> ~/tmp/{}-prom-conf-rules"
Wrapping up: rolling things out
This is the shortest part of the blog post, because it was the least eventful part of the project. Using the graphs and snapshot testing framework described above, we were able to get all of our soaconfigs migrated to a new API format, and a handful of services are now using the Kubernetes multi-metric scaling feature-all with no downtime or outages. As it turns out, there was nothing magical or particularly hard about the rollout; just a careful application of testing and a close eye on our graphs and charts.
Become a Software Engineer at Yelp
Want to help us make even better tools for our full stack engineers?
View Job