Revenue Automation Series: Building Revenue Data Pipeline

-
Yizheng Zhang, Software Engineer; Yirun Zhou, Software Engineer
- Feb 19, 2025
Background
As Yelp’s business continues to grow, the revenue streams have become more complex due to the increased number of transactions, new products and services. These changes over time have challenged the manual processes involved in Revenue Recognition.
As described in the first post of the Revenue Automation Series, Yelp invested significant resources in modernizing its Billing System to fulfill the pre-requisite of automating the revenue recognition process.
In this blog, we would like to share how we built the Revenue Data Pipeline that facilitates the third party integration with a Revenue Recognition SaaS solution, referred to hereafter as the REVREC service.
Our Journey to Automated Revenue Recognition
The REVREC service provides the following benefits in recognizing revenue:
- Recognize any revenue stream with minimal cost and risk for one time purchases and subscriptions, offered at either flat rates or variable prices.
- Unblock a continuous accounting process, reconcile revenue data in real-time so the Accounting team can close the books up to 50% faster.
- Forecast revenue in real-time, which gives us access to out of the box reports and dashboards for revenue analytics.
In order to get all the benefits above, we needed to ensure the REVREC service had the right data to recognize revenue. Therefore, a centerpiece of this project was to build a data pipeline that collects and produces quality revenue data from Yelp’s ecosystem to the REVREC service.
Step 1: Handle Ambiguous Requirement
We started with a list of product requirements around a standard revenue recognition process as below:

Let’s take a look at one of the example requirement under Define Transaction Amount section: The total contract value (TCV) should be captured during booking as revenue to be recognized based on fair value allocation by each line will be different from invoice amount.
These requirements were written for accountants but were quite challenging for engineers to comprehend. In order to translate it down to engineering friendly requirements and make sure we reached cross functional alignment, we followed the below methodology to break it down:
First, we needed to create a Glossary Dictionary that mapped business terms to engineering terms at Yelp. Having such mapping quickly aligned the understanding among cross functional teams. For the example requirement, the Glossary Dictionary is illustrated as below:
Requirement: The total contract value (TCV) should be captured during booking as revenue to be recognized based on fair value allocation by each line will be different from invoice amount.
Glossary Dictionary
- Revenue Contract: A subscription order placed on Yelp’s Biz Site.
- Booking: The moment when a user completes a subscription purchase request.
- Fair Value: The gross amount if we sell this product standalone.
- Each Line: The minimum granularity that we track fulfillment and billing of a product feature.
- Invoice Amount: The net amount that on ledger for a product feature in a revenue period.
Second, we needed to extract the purpose of this requirement so that we understand why we needed certain data in the first place, and what data is closest to the business need. It was also helpful to explain it with an example calculation.
Purpose:
- Make sure revenue allocation is based on the price if we sell this product alone, and not based on how much we actually bill this product.
- Example Calculation:
- Product A standalone selling price is $100
- Product B standalone selling price is $20
- Subscription bundles of Product A and B, sells product A for $100, product B as add-on for free.
- Total Revenue of subscription order $100 should be split based on the standalone selling price, A’s share 100/120 * 100 = 83.333, B’s share 20/120 * 100 = 16.667
Finally, we translated the original requirement into an engineering friendly requirement as below:
The REVREC service requires a purchased product’s gross amount to be sent over whenever a user completes a subscription order, this amount is possible to be different from the amount we actually bill the user.
Step 2: Data Gap Analysis
The project team also faced challenges integrating Yelp’s custom order-to-cash system (details can be found in this blog post) with a standard ETL(Extract, Transform and Load) architecture that usually works well in such projects. This led to a data gap analysis to align Yelp’s data with the required template for integration.
Some of the main challenges and the solutions included:
- Data Gaps
- Issue: No direct mapping between fields in Yelp’s system and the 3rd Party System.
- Immediate Solutions:
- Use approximations, e.g., using gross billing amounts as list prices.
- Composite data, e.g., creating unique monthly contract identifiers by combining product unique IDs with revenue periods.
- Long-term Solution: Develop a Product Catalog system for common product attributes.
- Inconsistent Product Implementation
- Issue: Data attributes were scattered across various databases for different products.
- Immediate Solutions:
- Pre-process data from different tables into a unified schema.
- Categorize and preprocess data by type (e.g., subscription, billing, fulfillment).
- Long-term Solution: Propose unification of billing data models into a centralized schema for future needs.
The outcome of data gap analysis not only clarified the immediate solutions to support automated revenue recognition with status quo data, but also gave us better direction on long term investment that would make the custom order-to-cash system closer to industry standards so that the data mapping would be more straightforward.
Step 3: System Design Evaluations
At Yelp, there are many options for processing, streaming and storing data at a large scale. We considered the available options and evaluated their pros and cons before picking the option that would suit our requirements.
We had the following design choices for storage and data processing framework:
Option 1: MySQL + Python Batch:
- Traditional method for generating financial reports.
- Rejected due to inconsistent rerun results from changing production data and slow batch processing times during peak data volumes.
Option 2: Data Warehouse + dbt:
- Uses SQL for data transformation, allowing non-engineers to update jobs.
- Rejected due to difficulty representing complex logic in SQL.
Option 3: Event Streams + Stream Processing:
- Proven technology with near real time data processing capability.
- Rejected because immediate data presentation isn’t necessary, and third-party interfaces don’t support stream integration, adding complexity without benefits.
Option 4: Data Lake + Spark ETL:
- MySQL tables are snapshotted daily and stored in a Data Lake, then processed with Spark ETL.
- Preferred choice, benefits include independent reproducibility of data sources and processing, scalability during peak times, and strong community support.
Ultimately, we chose the Data Lake + Spark ETL option. However, it presented challenges such as managing complex data processing DAGs and translating existing business logic from Python to PySpark efficiently. We will discuss how those challenges are addressed in the following section.
Address Technical Challenges
Manage Complex Spark ETL Pipeline
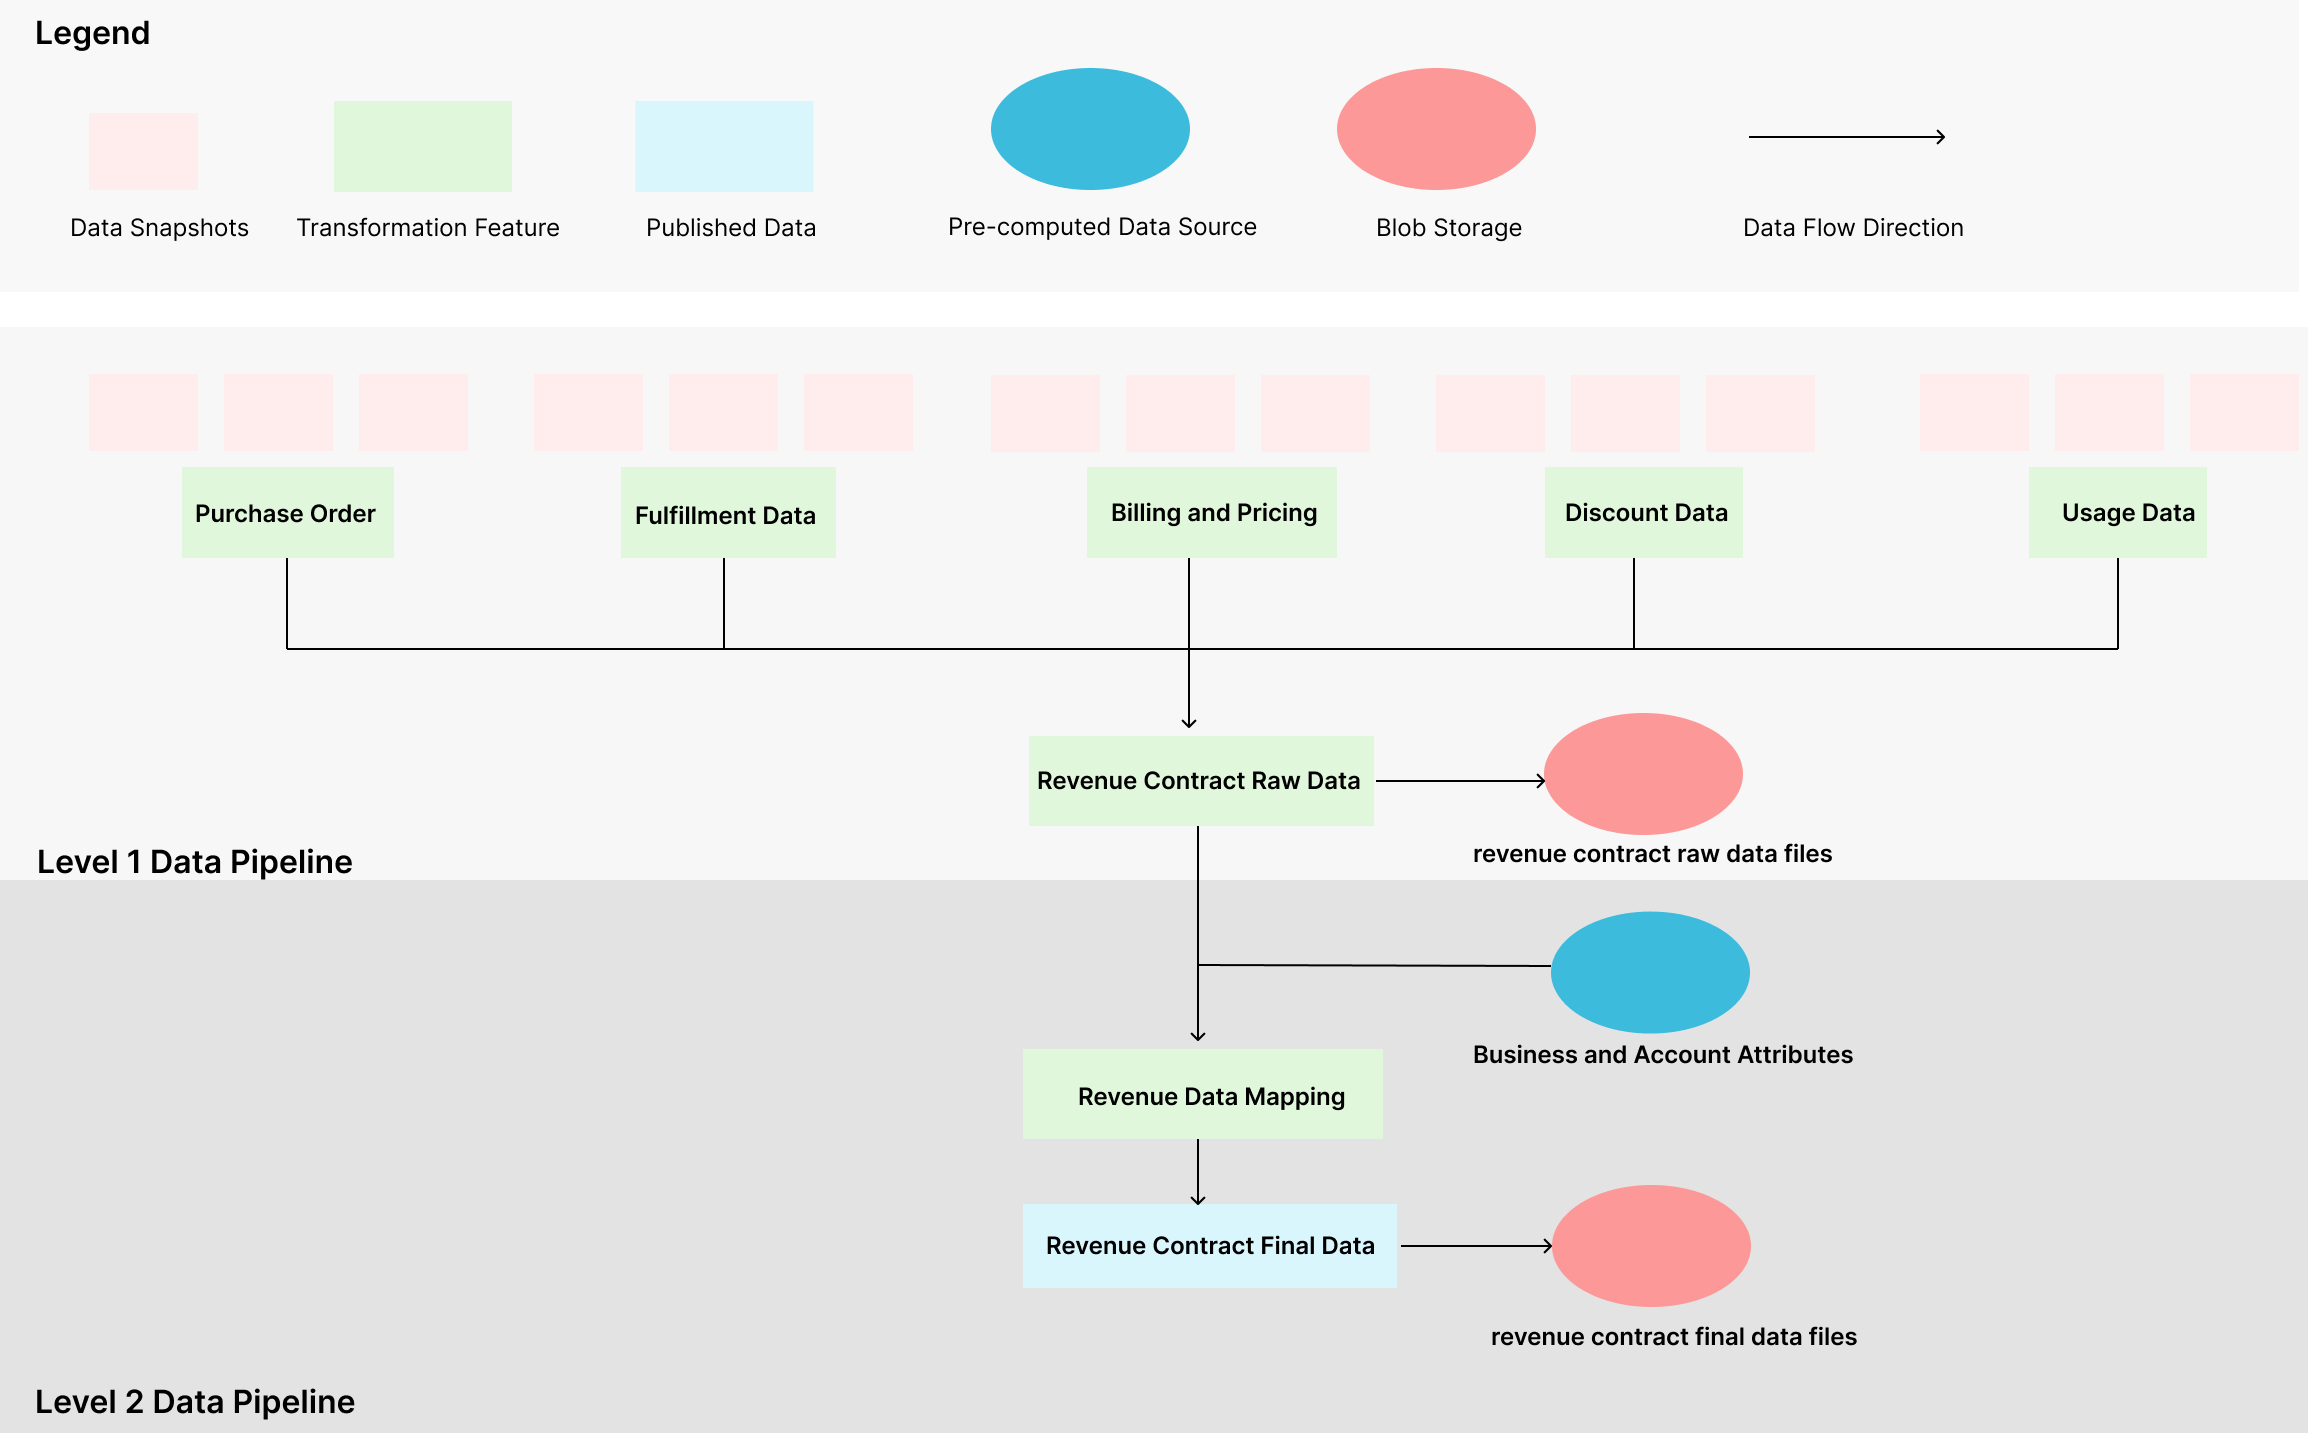
Reporting Revenue Contract data requires comprehensive data from different sources including raw mysql table snapshots and some pre-computed data source from external systems.
It also involves multiple stages of data transformation where we need to aggregate data in categories, add additional fields by applying transformation logic, join and then map them into final data templates. You can get a sense of the Spark ETL pipeline by viewing a simplified diagram below:
 Managing such complex ETL pipelines can be a daunting task, especially when dealing with intricate revenue recognition logic. At Yelp, we used an internal package called spark-etl to streamline this process. In this section, we’ll explain how spark-etl helps us manage and maintain our ETL pipelines effectively.
Building Blocks - Spark Features
The building blocks of a Spark-ETL program are Spark features, which define the input, transformation logic, and output. These features resemble web APIs with their request-response schemas.
In our design, we classified Spark features into two categories: source data snapshot features and transformation features.
Source Data Snapshot Features
Source data snapshot features read database snapshots from S3 and pass the data downstream without any transformation. This raw data can then be reused by various transformation features. Here’s an example of how source data is retrieved from S3 location:
class ARandomDatabaseTableSnapshotFeature(SparkFeature):
    alias = f"{TABLE_NAME}_snapshot"

    def __init__(self) -> None:
        self.sources = {
            TABLE_NAME: S3PublishedSource(
            	   base_s3_path=get_s3_location_for_table(TABLE_NAME),
            	   source_schema_id=get_schema_ids_for_data_snapshot(TABLE_NAME),
            	   date_col="_dt",
            	   select_cols=TABLE_SCHEMA,
            )
  }

    def transform(
        self, spark: SparkSession, start_date: date, end_date: date, **kwargs: DataFrame
    ) -> DataFrame:
        return kwargs[TABLE_NAME]
Transformation Features
Transformation features take in source data snapshot features or other transformation features as pyspark.DataFrame objects. They perform various transformations like projection, filtering, joining, or applying user-defined functions. Here’s an example of pyspark.DataFrame operations in a transform function:
class ARandomTransformationFeature(SparkFeature):
    def __init__(self) -> None:
        self.sources = {
            "feature_x": ConfiguredSparkFeature(),
            "feature_y": ConfiguredSparkFeature(),
        }

    def transform(
        self, spark: SparkSession, start_date: date, end_date: date, **kwargs: DataFrame
    ) -> DataFrame:
        feature_x = kwargs["feature_x"]
        feature_y = kwargs["feature_y"]

        # Transform DataFrame based on needs
        feature_x = feature_x.withColumn(
            "is_flag", lit(False).cast(BooleanType())
        )
        feature_y = feature_y.withColumn(
            "time_changed", lit(None).cast(IntegerType())
        )
        aggregated_feature = feature_x.unionByName(feature_y).drop("alignment")
        return aggregated_feature.filter(
            (
                aggregated_feature.active_period_start
                <= aggregated_feature.active_period_end
            )
            | aggregated_feature.active_period_end.isNull()
            | aggregated_feature.active_period_start.isNull()
        )
Dependency Management
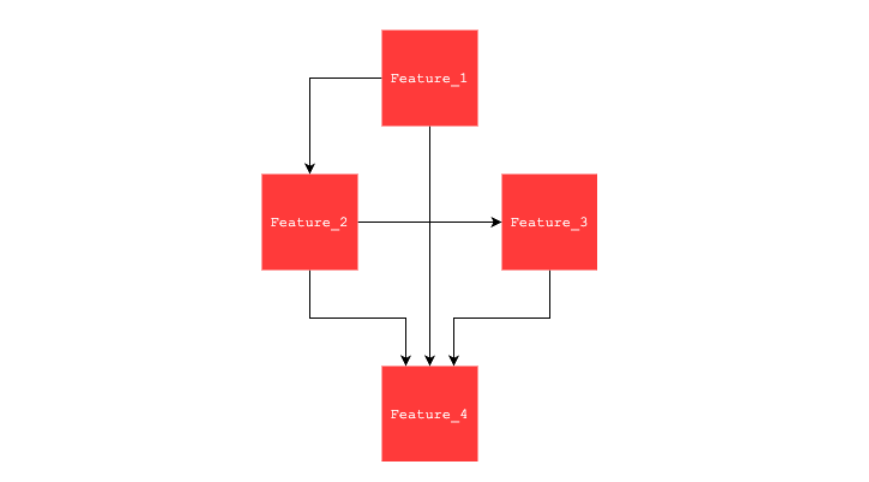
The dependency relationship is handled by a user defined yaml file which contains all the related Spark features. There is no need to draw a complex diagram of dependency relationships in the yaml file. At runtime, spark-etl figures out the execution sequence according to topology.
For instance, if the relationship is presented as the below DAG, the corresponding yaml configuration only needs to specify the nodes but not the edges to keep the configuration dry, since the edges are already defined in SparkFeature.sources.
features:
    <feature1_alias>:
        class: <path.to.my.Feature1Class>
    <feature2_alias>:
        class: <path.to.my.Feature2Class>
    <feature3_alias>:
        class: <path.to.my.Feature3Class>
    <feature4_alias>:
        class: <path.to.my.Feature4Class>

publish:
    s3:
        - <feature4_alias>:
            path: s3a://bucket/path/to/desired/location
            overwrite: True
Debugging
Given the distributed nature and lazy evaluation of Spark programs, it’s hard to set a breakpoint and debug interactively, and the fact that this new data pipeline often deals with data frames that have thousands and even millions of rows, checkpointing intermediate data frames to a scratch path would be a convenient way to inspect data for debugging and resuming pipeline faster by specifying computational expensive features’ paths.
Yelp’s Spark-etl package enables features to be checkpointed to a scratch path, for example:
spark-submit \
     	/path/to/spark_etl_runner.py \
     	--team-name my_team \
     	--notify-email my_email@example.com \
     	--feature-config /path/to/feature_config.yaml \
     	--publish-path s3a://my-bucket/publish/ \
     	--scratch-path s3a://my-bucket/scratch/ \
     	--start-date 2024-02-29 \
     	--end-date 2024-02-29 \
     	--checkpoint feature1, feature2, feature3
Then Jupyterhub came in handy when reading those checkpointed data, making the debugging experience more straightforward and shareable among the team.
Translating Python Logic to Pyspark
At Yelp, our revenue recognition process involves numerous business rules due to the variety of products we offer. Converting such logic into a PySpark transformation function requires careful design and possibly several iterations. While PySpark’s SQL-like expressions (such as selects, filters, and joins) are powerful, they may not be flexible enough for complex business logic. In such cases, PySpark UDFs (User Defined Functions) provide a more flexible solution for implementing intricate rules, like discount applications. We used PySpark UDFs in various logic that was too complex for SQL-like expressions to handle.
There are two types of UDFs in PySpark: pyspark.sql.functions.udf and pyspark.sql.functions.pandas_udf. While both serve similar purposes, this demonstration will focus on the former for simplicity.
UDF Example: Business Rules for Discount Application
Consider the following simplified business rules for applying discounts:
- A product can consider a discount as applicable if its active period completely covers the discount’s period.
- Each product can receive only one discount.
- Type A products receive discounts before Type B products.
- If products have the same type, the one with the smaller ID receives the discount first.
- Discounts with smaller IDs are applied first.
UDF Example: Implementation
After grouping both products and discounts by customer_id, we need to determine the discount application for each product. Here’s a Python function that encapsulates this logic, how it can be applied to the grouped data frames and how to retrieve the results:
@udf(ArrayType(DISCOUNT_APPLICATION_SCHEMA))
def calculate_discount_for_products(products, discounts):
    # Sort products and discounts based on priority
    products = sorted(products, key=lambda x: (x['type'], x['product_id']))
    discounts = sorted(discounts, key=lambda x: x['discount_id'])

    results = []
    for product in products:
        for discount in discounts:
            if period_covers(discount['period'], product['period']) and discount['amount'] > 0:
                amount = min(product['budget'], discount['amount'])
                discount['amount'] -= amount
                results.append((product['product_id'], product['type'], product['period'], amount, discount['discount_id']))
                break

    return results

# Say that we have previously grouped products and discounts by business_id(code not shown here)
# Apply the UDF above
result_df = (
    grouped_contracts_with_biz_discounts.withColumn(
        "results",
        calculate_discount_for_products("products", "discounts"),
    )
)
# Then explode the discount application by selecting the key of grouping products and discounts,
# in this case business_id
result_exploded = result_df.select(
    "business_id", explode("results").alias("exploded_item")
)

# Retrieve product and the applied discount amount/id from exploded items
result_exploded = result_exploded.select(
    "business_id",
    "exploded_item.product_id",
    "exploded_item.amount",
    "exploded_item.discount_id",
)
Without using UDFs, implementing this logic would require multiple window functions, which can be hard to read and maintain. UDFs provide a more straightforward and maintainable approach to applying complex business rules in PySpark.
Future Improvements
We understand that solutions mentioned above don’t come without a cost
- We still have 50+ features in the 2-staged spark jobs which can be really challenging for a single team to maintain and develop in the future. Adding a new product would require changes and testing in the whole spark job.
- We rely heavily on UDFs on calculating revenue period and contract amount. These UDFs are expensive to run and can penalize performance and reliability of the job over time.
We are exploring future improvements to address these challenges:
- Enhanced Data Interfaces and Ownership: Feature teams will own and manage standardized data interfaces for offline consumption, ensuring consistent data availability for analysis and reporting. These interfaces abstract implementation details, offering flexibility for teams to make changes without disrupting reporting processes.
- Simplified Data Models: Simplifying source data models minimizes the need for custom UDFs, as mappings can be handled with standard PySpark functions.
- Unified Implementation: Standardizing implementation across products and leveraging high-level data interfaces reduces input tables, streamlining Spark feature topology and lowering maintenance overhead.
More on Revenue Automation Series
In this blog, we talked about how we handled ambiguous requirements in building a data pipeline for automating revenue recognition at Yelp. We also discussed system design decisions we made and technical challenges we addressed.
In the next article in series, we will discuss topics related to ensuring data integrity, reconciling data discrepancies and all the learnings from working with 3rd party systems. Stay Tuned!
Acknowledgement
This is a multi-year, cross organization project that relies on all teams’ tenacity and collaboration to scope, design, implement, test and take it to the finish line. As of today, we have automated nearly all Yelp’s revenue using this new system. A huge thank you to everyone in the project team for the great work. Special thanks for the support from Commerce Platform and Financial Systems Leadership and all stakeholder teams involved in this project.
Join Our Team at Yelp
We're tackling exciting challenges at Yelp. Interested in joining us? Apply now!
View Job