Revenue Automation Series: Testing an Integration with Third-Party System

-
Anukriti Mishra, Software Engineer; Chukwuemeka Okobi, Software Engineer
- May 27, 2025
Background
As described in the second blog post of Revenue Automation series, Revenue Data Pipeline processes a large amount of data via complex logic transformations to recognize revenue. Thus, developing a robust production testing and integration strategy was essential to the success of this project phase.
The status quo testing process utilized the Redshift Connector for data synchronization once the report was generated and published to the data warehouse (Redshift). This introduced a latency of approximately 10 hours before the data was available in the data warehouse for verification. This delay impacted our ability to verify whether the changes were accurately reflected and the data was updated as required. Additionally, the initial process involved manual data verification, increasing the risk of human error.
To enhance efficiency and minimize manual effort, we implemented a new testing strategy leveraging the concept of a “staging pipeline” which is discussed further in this blog. This improvement significantly accelerated the testing process as the data was available immediately after the reports were generated. This allowed the pipeline to detect errors earlier in the process.
Due to the unique nature of Yelp’s product implementation, we faced some challenges in testing the pipeline:
- Since the development environments have limited data, the different edge cases that occur in production could not be covered during dev testing. This was discovered when the data pipeline was executed in production for the first time.
- We needed to ensure that the changes implemented in the development region do not affect data correctness in the production pipeline.
- We had to find a way to test the pipeline behavior with production data before release.
Execution Plan
Glossary
- Billed Revenue — This is the amount that Yelp invoices the customer for.
- Earned Revenue / Estimated Revenue — This revenue is calculated when Yelp fulfills the delivery of a purchased product.
- Revenue Period — Time period during which we recognize revenue for a product.
- Revenue Contract — This defines the terms under which services are delivered, and revenue is recognized.
- Redshift Connector — A Data Connector that loads data from Data Pipeline streams into AWS Redshift.
- Latency — The time it takes for the Redshift connector to process input data.
- Data Pipeline - Data Pipeline ecosystem refers to Yelp’s infrastructure for streaming data across services.
To ensure data correctness, we followed the steps discussed below:-
Step 1: Staging Pipeline Setup
We set up a separate data pipeline configuration, referred to as the staging pipeline, in parallel with the production pipeline. Its results were published to AWS Glue tables which enabled us to solve the Redshift Connector latency problem by making data immediately available for querying via Redshift Spectrum. When new changes to the code were implemented, the staging pipeline was modified to reflect them and was executed using production data. This approach allowed us to validate changes in a production environment by easily comparing staging and production results, eliminating the need to revert changes in the production pipeline when bugs were introduced.
The diagram below illustrates the parallel pipeline.
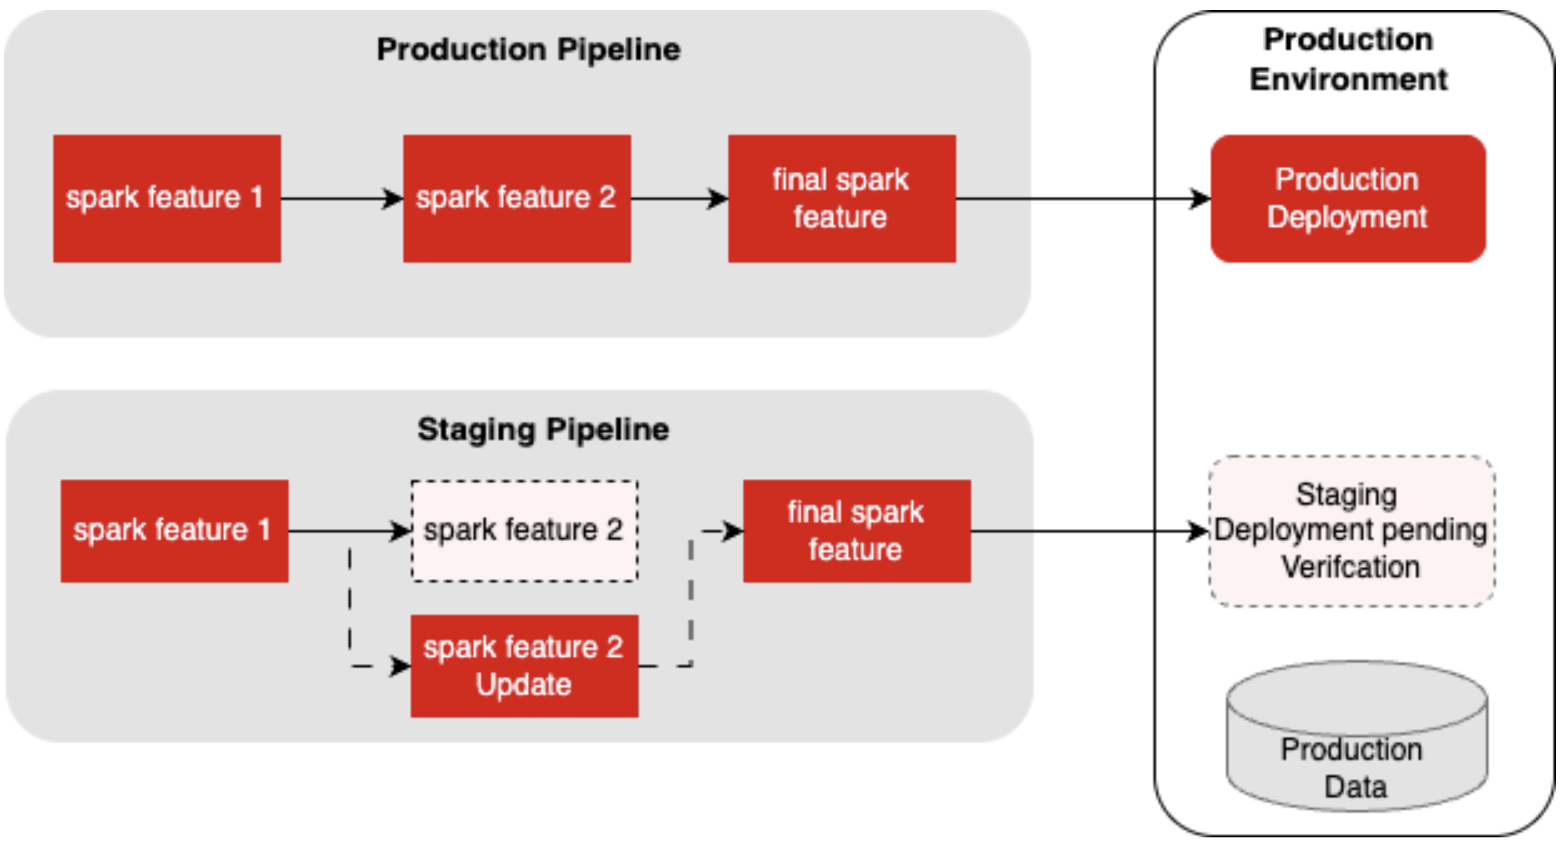
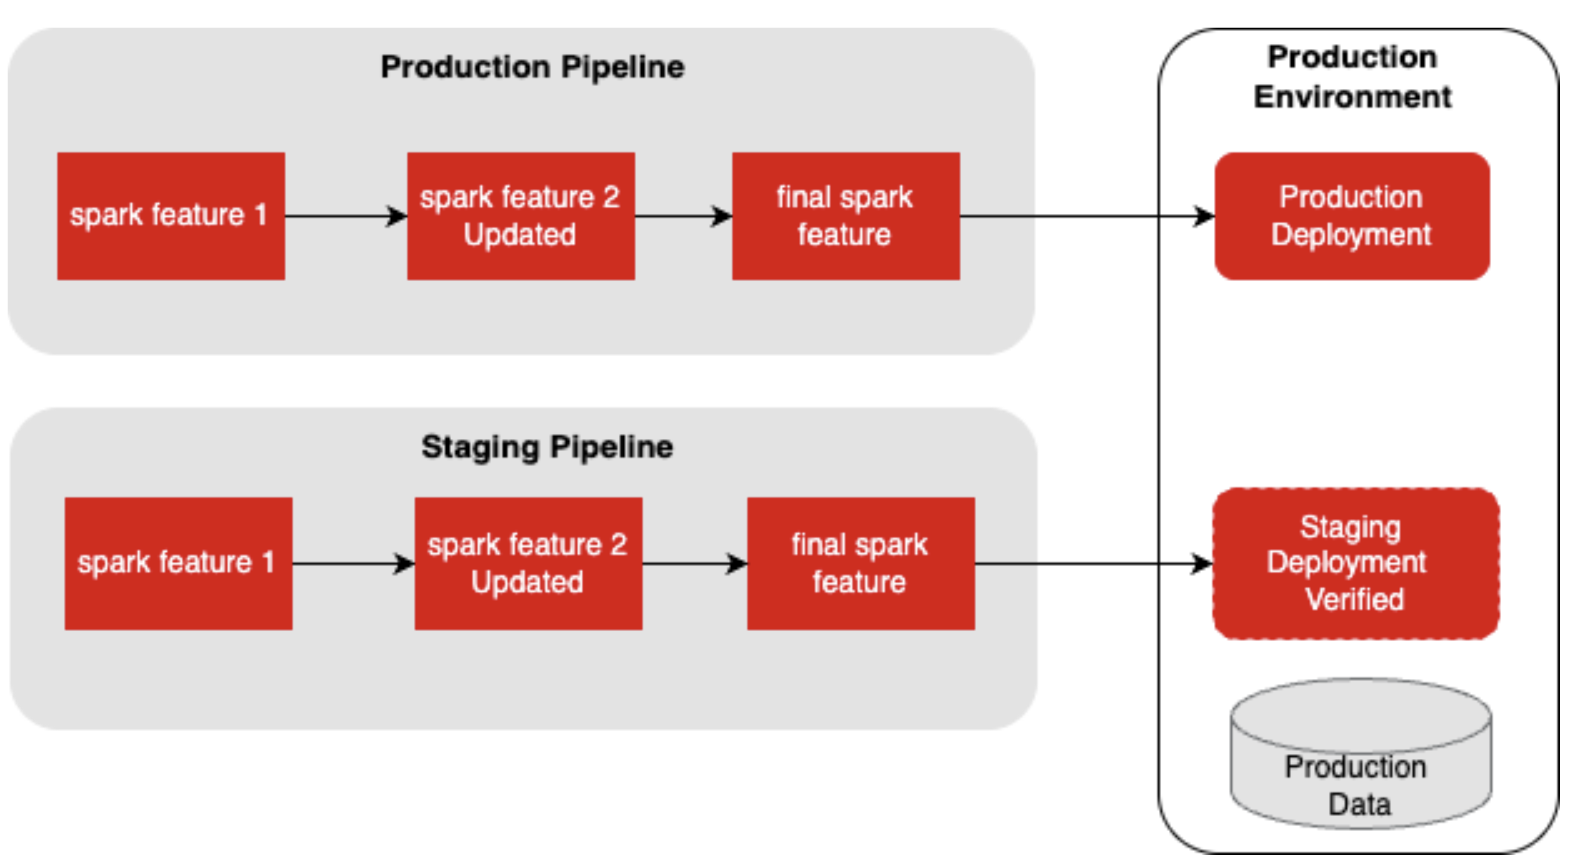
With this approach, the production pipeline and its data were left untouched until the new changes were verified before updating it.
The diagram below shows both pipelines after staging verification.
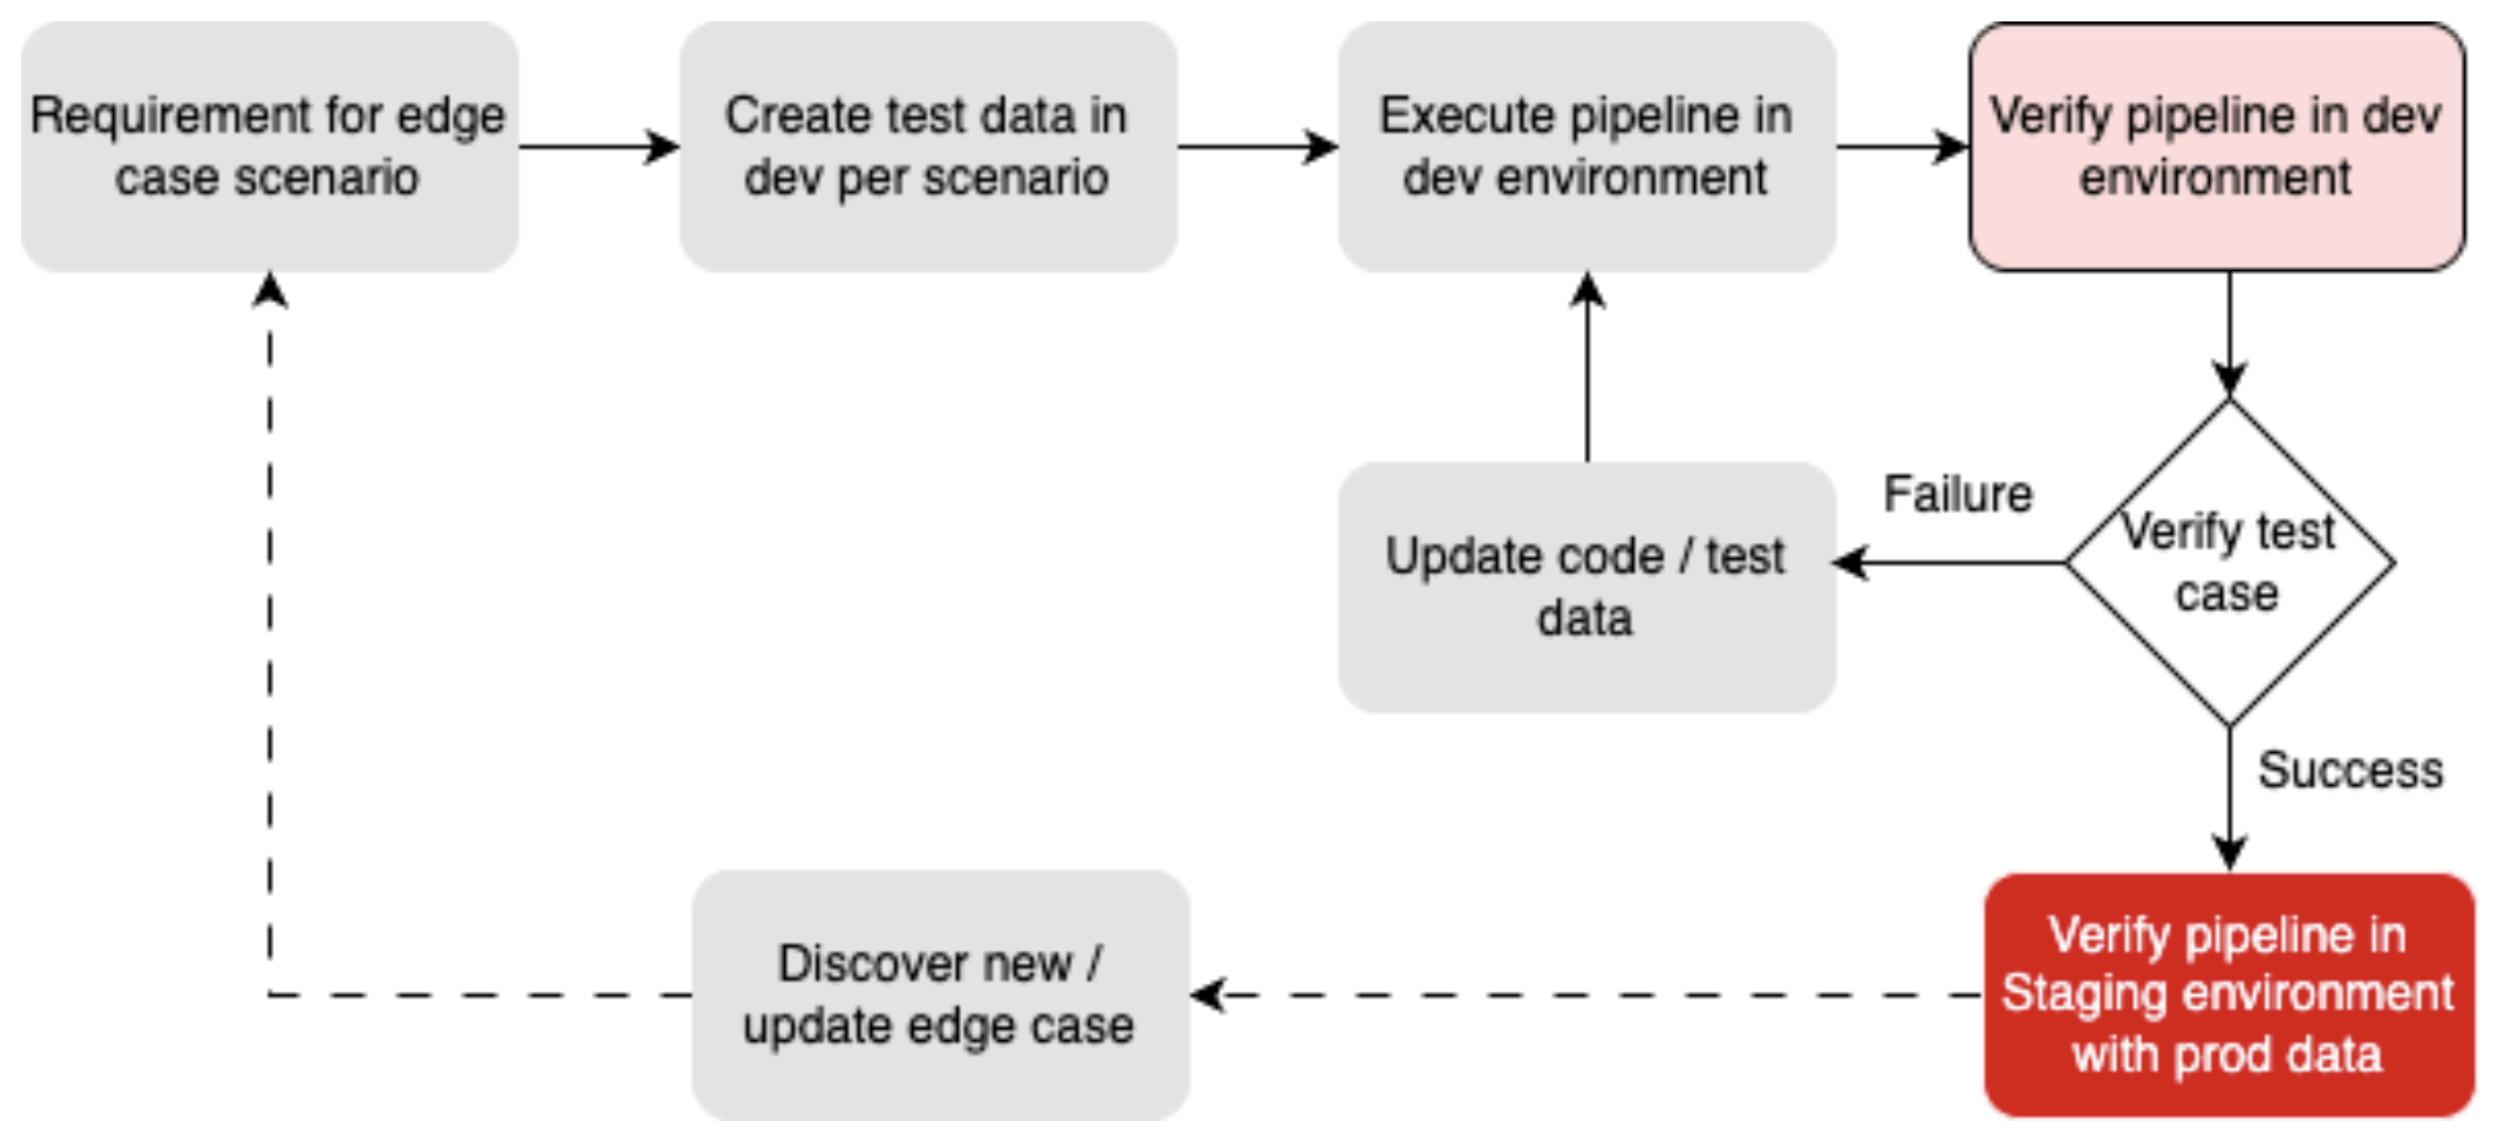
Test data in the development environment was very limited as Yelp has various products with different edge cases and revenue calculation requirements in production, thus increasing the gap between the two data sets.
We had to outline different scenarios and edge cases that might occur in production and create data in the dev environment to mimic those scenarios. Once an edge case was discovered via manual verification and data integrity checks (as explained in step 3), new data points were created in the dev environment to replicate that scenario.
The diagram below illustrates the process.
Step 2: Test Data Generation
Test data in the development environment was very limited as Yelp has various products with different edge cases and revenue calculation requirements in production, thus increasing the gap between the two data sets.
We had to outline different scenarios and edge cases that might occur in production and create data in the dev environment to mimic those scenarios. Once an edge case was discovered via a manual verification and integrity checker (as explained in step 3), new data points were created in the dev environment to replicate that scenario.
The diagram below illustrates the process.
The large number of database tables required as input to the pipeline made this process very tedious as it involved manual creation of data points. Hence, for the development and testing of some scenarios, we relied heavily on the staging pipeline for verification. In the future, we plan to automate the creation of test data in the development environment, as discussed in the Future Improvements section.
Step 3: Data Integrity Checkers
Ideally, integrity checks are developed to compare the output of a process and its source data. In our case, it was a comparison between revenue contract data pipeline results which includes estimated revenue versus the billed revenue produced by Yelp’s billing system. Various metrics were explored to improve the reliability of the pipeline results. Some of the critical metrics include:
-
Number of contracts matching invoice (billed transaction) gross revenue: We wanted to verify that at least 99.99 percent of the contracts matched the billed revenue as this level of accuracy was required to ensure the reliability of the system.
-
Number of contracts with mismatched discount invoice: With Yelp offering different discounts and promotions applied at the business and product offering level, we had to ensure that the pipeline predicts the discount application as close as possible to the billing system.
-
Number of contract lines with no equivalent invoice: Some of Yelp’s product offerings are billed differently. Some are manually billed and don’t necessarily pass through the automated billing process. We wanted to figure out how many of these contracts were being reported by the pipeline and if an invoice generated through the billing system was not recognized by the automated pipeline.
-
Number of duplicate or past contract lines: We also wanted to confirm that we sent unique contracts and prevented redundant past contracts from entering the Revenue Recognition system.
After finalizing the required reporting metrics, the next steps in developing the integrity checker presented further challenges:
-
The pipeline used snapshots of the database as its daily source, that is, the daily state of the source database is saved in a data lake, but the database itself is constantly changing.
-
Products are mostly billed at the end of the monthly period. Thus, we would have to rely on monthly comparisons for confirming data accuracy.
The Revenue Data Pipeline is designed to send data for revenue recognition on a daily basis and the ideal data source of truth is the revenue data produced each month by Yelp’s billing system. To resolve this, we decided to develop both monthly and daily checks.
- Monthly Integrity Check: Revenue Recognition pipeline data was published to redshift tables. Data from the billing system and contract pipeline were compared via SQL queries. Determining the right SQL queries was done iteratively, accounting for different edge cases based on the variety of products offered at Yelp.
Sample Monthly Check Result format
---- Metrics ----
Number of contracts reviewed: 100000
Gross Revenue:  xxxx
Net Revenue:  xxxx

Number of contracts matching both gross & net:  99799
Gross Revenue: xxxx
Net Revenue:  xxxx

Number of contracts with mismatch discount: 24
Gross Revenue: xx
Net Revenue:  xx

Number of contracts with mismatch gross revenue:  6
Gross Revenue: xx

Number of contracts with no equivalent invoice:  1
Gross Revenue:  xx
Net Revenue:  xx

Number of invoice with no equivalent contract:  10
Gross Revenue:  xx
Net Revenue:  xx

Line match %: 99.997
Net revenue mismatch difference:  1883.12
- Daily Integrity Check: Waiting for the end of the month to determine data accuracy would lead to challenges when implementing quick code modifications and data correction backfills. Publishing the data generated by the pipeline to the Redshift database experiences latency of more than 10 hours before the data becomes available. To perform checks as quickly as possible after the pipeline run completes, we implemented daily checks in two steps.
-
We published data to data lake and created AWS Glue data catalog tables to read from the data storage immediately, once the data became available.
-
We implemented SQL queries on the staging pipeline results, as explained in the Staging Pipeline Setup section.
-
If any discrepancies were discovered, we would swiftly determine the cause, correct it, and rerun the pipeline for the day.
Sample Daily Check Result Format
	---- Metrics ----
number of contracts with negative revenue:  0
number of contracts passed or expired:  28
number of contracts with unknown program:   0
number of contracts missing parent category:   66
Step 4: Data Format Validation
To support a streamlined data upload process, we had to verify that the data required for upload to a third-party system met system-specific validation rules. We faced a few challenges where the internal file data format, column mapping sequence, or differences in the external table schema led to upload failures.
To avoid such failures, we developed a Schema Validation Batch, which retrieves the field mapping from the external system using a REST APl and compares it against the revenue data schema before proceeding with the data upload.
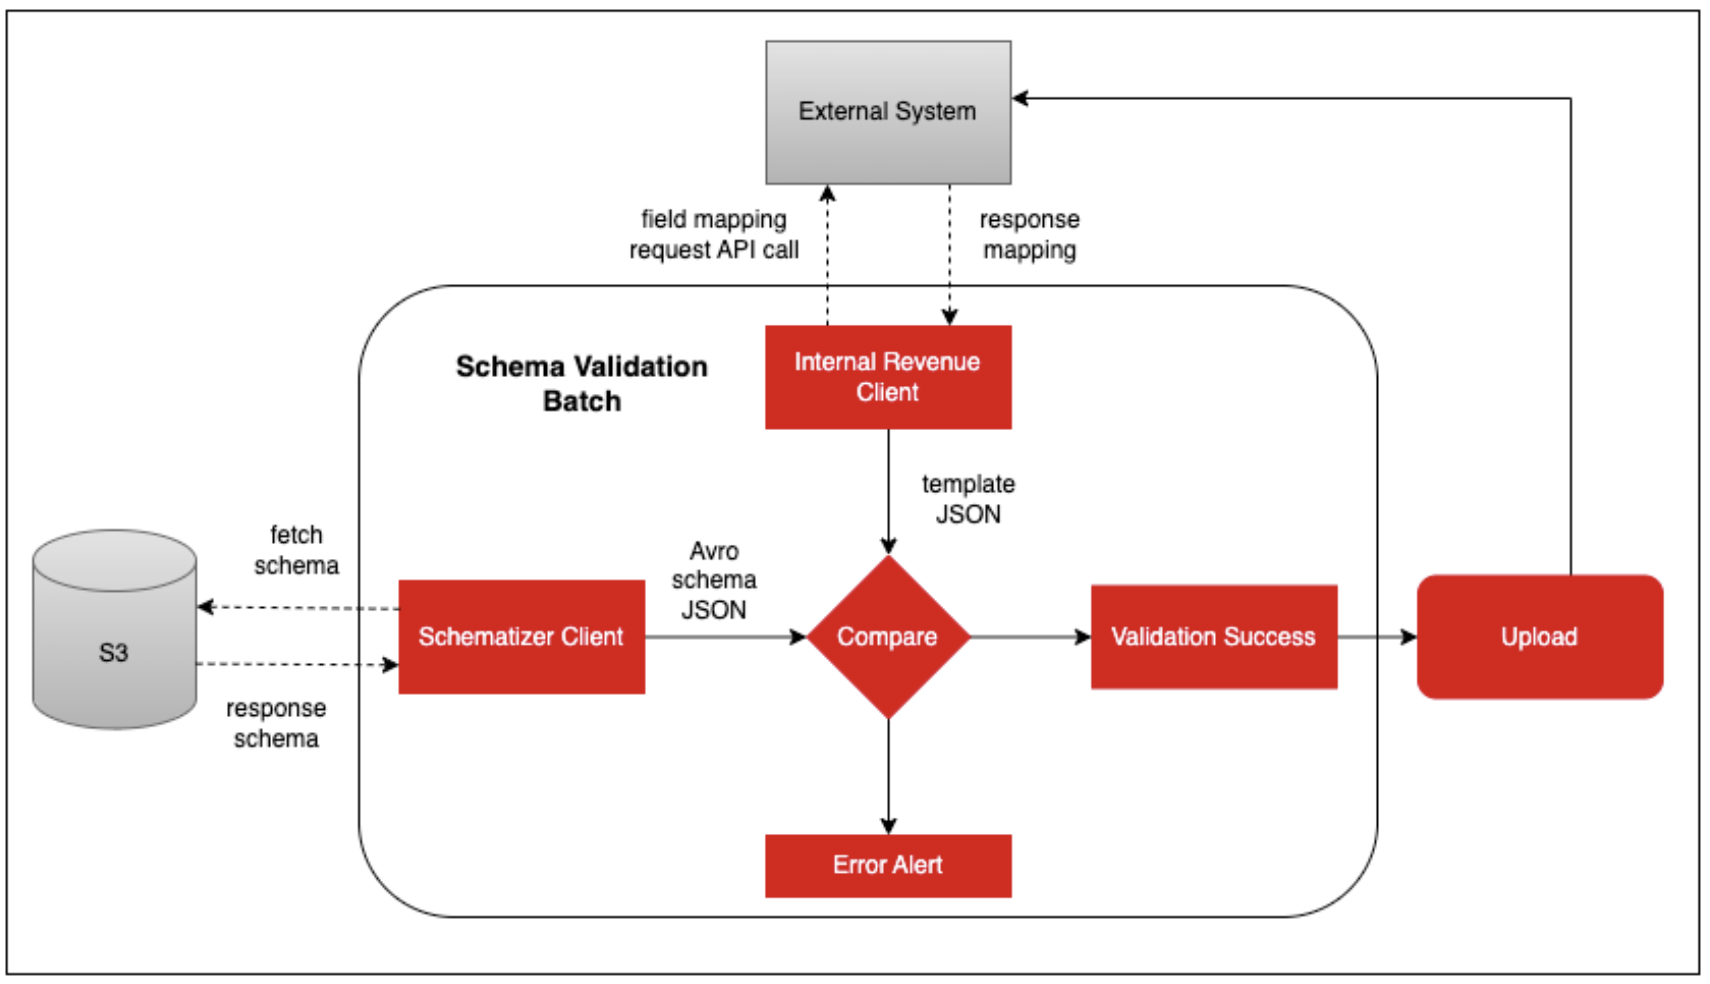
This validation layer minimized failure risks and improved system reliability. Here is an example of a request/response to retrieve the required details.
-- Request
curl -X GET --header "token: RandomBasicToken" "https://yourHost/api/integration/v1/upload/mapping?templatename=SAMPLE_TEMPLATE"
-- Response
{
	"Dateformat":"MM/DD/YYYY",
	"Mapping":[
		{
			"sample_column_id":1,
			"sample_column_name":"random",
			"sample_column_data_type":"string"
		}
	]
}
Step 5: Data Ingestion
We developed an Upload Batch in the integration layer, which compressed large data files for a specific report date and uploaded them to the external system. Logging and monitoring were enabled to identify issues and failures in a timely manner, contributing to building a more resilient process.
We implemented two methods for data upload:
- Upload using REST APIs: It is common practice to opt for standard HTTP methods, which are easy to use and scalable. This option was initially explored and used for uploads during the development phase. An example of an upload request/response is shown below:
-- Request
curl -X POST https://yourHost/api/integration/v1/upload/file \
-H 'cache-control: no-cache' \
-H 'content-type: multipart/form-data; boundary=----WebKitFormBoundary' \
-H 'templatename: Sample Template' \
-H 'token: <generated token>' \
-F 'file=sample_data_file.csv'

--Response
{"Message":"File consumed successfully" ,"Result":{"file_name":"sample_data_file.csv","file_request_id":"1000"},"Status":"Success"}
- SFTP Upload: This method uses the SSH protocol, which provides encrypted data channels and protects sensitive data from unauthorized access. We implemented individual flag-level options for each environment to use the SFTP upload feature.
While testing these upload methods, we observed a few differences which are briefly discussed below:
-
Reliability issue: Testing revealed that the availability and performance of REST APIs posed reliability concerns. API responses were found to be flaky, which lead to inconsistent uploads and multiple retries.
-
File size limitations: REST APIs have a predefined limit of 50,000 records per file, which resulted in approximately 15 files being generated on a daily basis and approximately 50 files during the month-end closing period. By using the SFTP upload method, we increased the file size limit to between 500,000 and 700,000 records. As a result, the pipeline now generates only 4-5 files making the upload process more efficient and easier to maintain.
-
Set up process: The SFTP upload setup process was found to be less complex when compared to the API set up. To maintain a standardized and more efficient process across multiple pipelines at Yelp, such as the revenue contract and invoice data pipelines, the SFTP upload approach emerged as our preferred method.
After analyzing Yelp’s system and daily data volume requirements, we decided to enable SFTP upload as the primary method for the daily batch upload process.
Step 6: External System Support
We confirmed that files were successfully uploaded to the external Revenue Recognition System for the production region on a daily basis. In cases where the file became stuck on the external SFTP server, we relied on the external third-party team to resolve the issue on their end before services could resume. These issues could occur for several reasons, such as:
- SFTP Server downtime or service disruption
- Failure of the external upload job trigger after files were uploaded to the SFTP server
- Insufficient table space in the external system
To streamline the integration process, it is essential to maintain clear documentation and support channels to enable faster communication and issue resolution. We established internal guidelines for escalating high-priority issues and contacting the appropriate support teams.
Future Improvements
As we continue to enhance the existing implementation, future opportunities could include:
-
Automate test data generation: Manually creating test data is impractical due to the number of tables and unforeseeable edge cases. Automating test data creation could reduce development time and improve the overall testing process.
-
Optimize data generation pipeline: To reduce redundant contracts, discount calculations could be moved to the raw data generation phase, followed by an eligibility filter. This would enhance pipeline performance and improve report clarity.
-
Improve maintainability: Unexpected product types in reports can cause failures in external systems. Allowing users to include or exclude specific product types could ease new product onboarding, aid debugging, and prevent processing failures.
-
Enhance integrity checker: Improving discount matching could better align billed and earned revenue, increasing data accuracy.
-
Streamline third-party data upload: Creating a user interface for data uploads would give downstream teams better control across environments. Including upload history tracking could also reduce manual coordination, team dependencies, and delays.
Acknowledgements
We have come a long way with this project, and it has been a valuable and rewarding experience. Special thanks to everyone on the Revenue Recognition Team for their commitment to delivering this project, and to all the stakeholders from the Commerce Platform and Financial Systems teams for their support.
Join Our Team at Yelp
We're tackling exciting challenges at Yelp. Interested in joining us? Apply now!
View Job